CMO_v1_001
Download script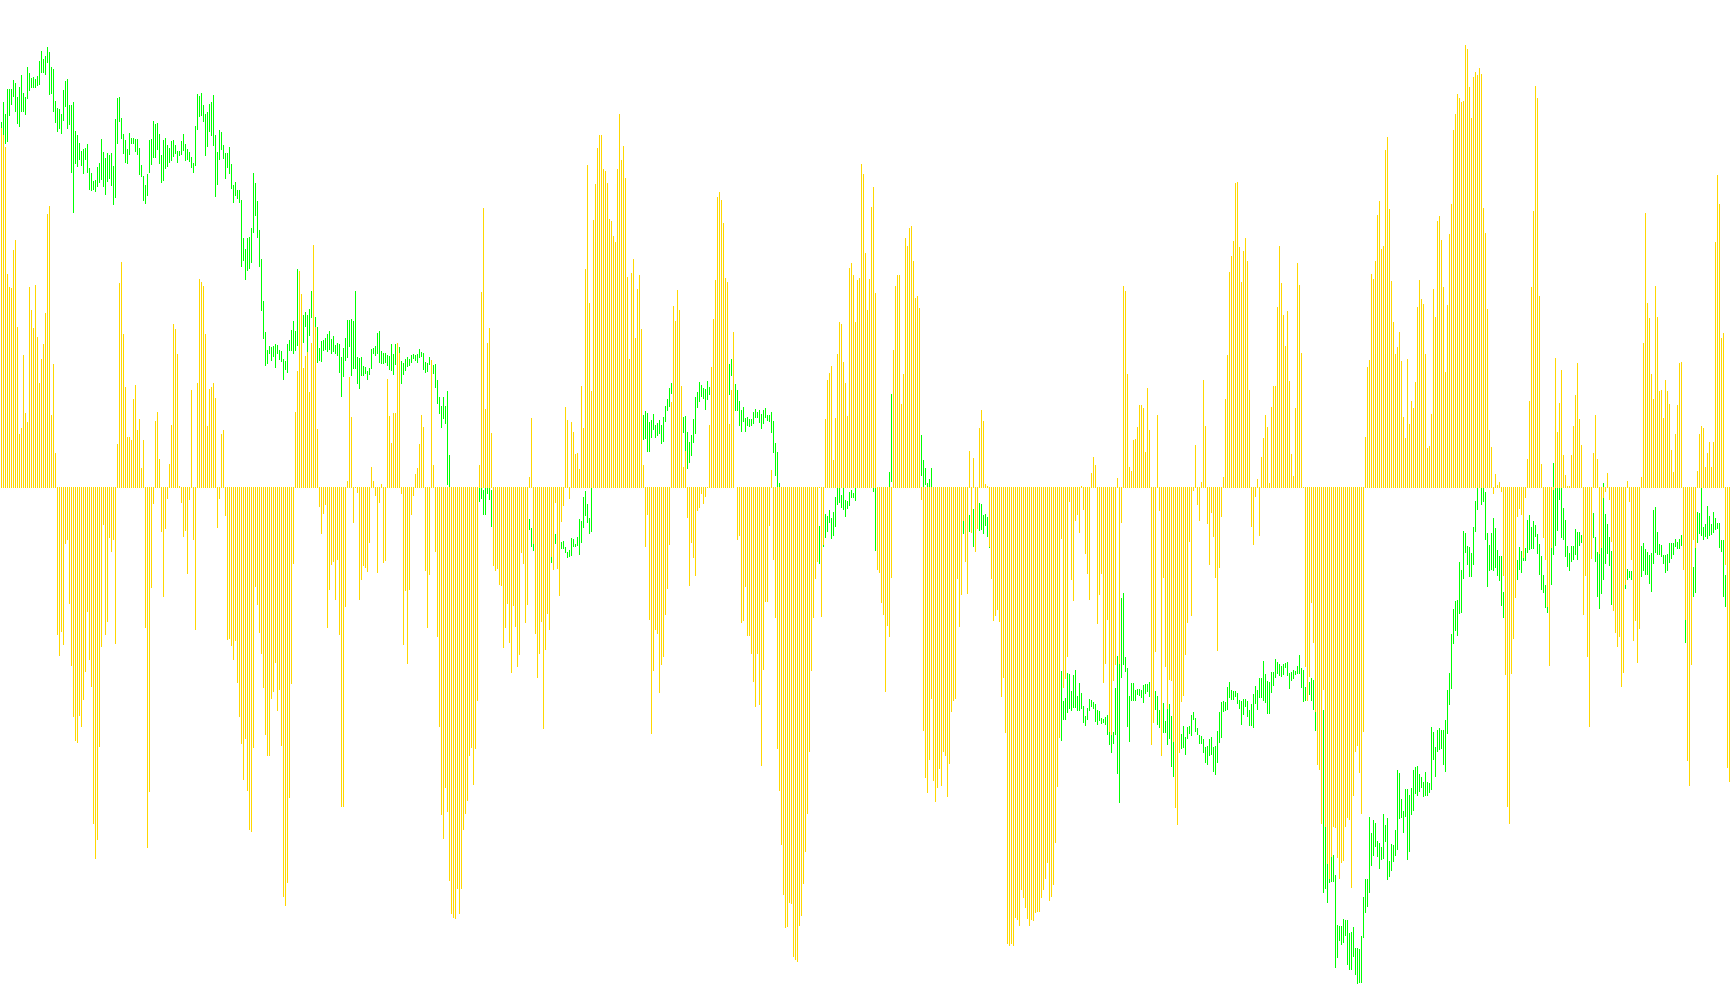
This tool is designed to provide a clear visual representation of market momentum by measuring the relative strength between buying pressure and selling pressure over a specific timeframe. It functions as an oscillator, making it easier for traders to identify whether the current trend is dominated by "bulls" (buyers) or "bears" (sellers).
Core Logic and Functionality
The script operates by analyzing price movements across a user-defined period. Instead of simply looking at where the price is currently, it focuses on the velocity and direction of change to determine market sentiment. Here is how that process works step-by-step:
1. Price Movement Analysis The tool first examines specific price points (such as the opening, closing, high, or low prices) over a very short interval. By comparing these points across consecutive bars, it identifies the immediate direction of the market movement.
2. Separating Bullish and Bearish Force The logic distinguishes between upward and downward movements:
- Bulls: The tool calculates the strength of upward price movements. If the price moves up, this value increases; if it moves down, it remains neutral or decreases.
- Bears: Simultaneously, the tool calculates the strength of downward price movements. Conversely, if the price moves up, the bearish force is minimized, while a downward move increases this value.
3. Accumulating Momentum Rather than just looking at the most recent tick, the script looks back over a set "Length" (a customizable number of bars). It adds up all the bullish and bearish forces accumulated during this period. This provides a "smoothed" view of the market, preventing the indicator from reacting too erratically to tiny, insignificant price flickers.
4. Calculating the Final Score Finally, the script performs a percentage calculation: it takes the difference between the total Bullish force and the total Bearish force and divides it by the sum of both forces. The result is multiplied by 100 to create a percentage-based oscillator.
How to Interpret the Results
The output is displayed in a separate window as a histogram that fluctuates between +100 and -100:
- Positive Values: Indicate that buying pressure is currently outweighing selling pressure. The higher the number toward +100, the stronger the bullish momentum.
- Negative Values: Indicate that selling pressure is dominant. The lower the number toward -100, the stronger the bearish momentum.
- Zero Line: This represents the equilibrium point. When the indicator crosses from negative to positive (or vice versa), it suggests a potential shift in the market's dominant sentiment.
By using this logic, traders can move beyond looking at raw price candles and instead see a simplified "tug-of-war" score that highlights who is currently winning the battle in the market.
//+------------------------------------------------------------------+
//|                                                       CMO_v1.mq4 |
//|                           Copyright © 2006, TrendLaboratory Ltd. |
//|            http://finance.groups.yahoo.com/group/TrendLaboratory |
//|                                       E-mail: igorad2004@list.ru |
//+------------------------------------------------------------------+
#property copyright "Copyright © 2006, TrendLaboratory Ltd."
#property link      "http://finance.groups.yahoo.com/group/TrendLaboratory"

#property indicator_separate_window
#property indicator_buffers   1
#property indicator_color1    LightBlue
#property indicator_width1    2
#property indicator_level1    0
#property indicator_level2   50
#property indicator_level3  -50
#property indicator_maximum  100
#property indicator_minimum -100
//---- input parameters
extern int       Length = 14; // Period of evaluation
extern int       Price  =  5; // Price mode : 0-Close,1-Open,2-High,3-Low,4-Median,5-Typical,6-Weighted
extern int       offset = 1;

//---- buffers
double CMO[];
double Bulls[];
double Bears[];

//+------------------------------------------------------------------+
//| Custom indicator initialization function                         |
//+------------------------------------------------------------------+
int init()
  {
//---- indicators
   IndicatorBuffers(3);
   SetIndexStyle(0,DRAW_HISTOGRAM);
   SetIndexBuffer(0,CMO);
   SetIndexBuffer(1,Bulls);
   SetIndexBuffer(2,Bears);
//---- name for DataWindow and indicator subwindow label
   string short_name="CMO("+Length+","+Price+")";
   IndicatorShortName(short_name);
   SetIndexLabel(0,"CMO");
//----
   SetIndexDrawBegin(0,Length);

   return(0);
  }

//+------------------------------------------------------------------+
//| Custom indicator iteration function                              |
//+------------------------------------------------------------------+
int start()
  {
   int      shift, limit, counted_bars=IndicatorCounted();
   double   Price1, Price2;
//----
   if ( counted_bars < 0 ) return(-1);
   if ( counted_bars ==0 ) limit=Bars-Length-1;
   if ( counted_bars < 1 )
   for(int i=1;i<Length;i++)
   {
   Bulls[Bars-i]=0;
   Bears[Bars-i]=0;
   CMO[Bars-i]=0;
   }


   if(counted_bars>0) limit=Bars-counted_bars;
   limit--;

   for( shift=limit; shift>=0; shift--)
   {
   Price1 = iMA(NULL,0,1,0,0,Price,shift+offset);
   Price2 = iMA(NULL,0,1,0,0,Price,shift+1+offset);

   Bulls[shift] = 0.5*(MathAbs(Price1-Price2)+(Price1-Price2));
   Bears[shift] = 0.5*(MathAbs(Price1-Price2)-(Price1-Price2));

   double SumBulls = 0, SumBears=0;
      for (i=0;i<Length;i++)
      {
      SumBulls += Bulls[shift+i];
      SumBears += Bears[shift+i];
      }
   CMO[shift] = (SumBulls-SumBears)/(SumBulls+SumBears)*100;
   }
   /*
   for( shift=limit; shift>=0; shift--)
   {
   double AvgBulls=iMAOnArray(Bulls,0,Length,0,0,shift);
   double AvgBears=iMAOnArray(Bears,0,Length,0,0,shift);

   CMO[shift] = (AvgBulls-AvgBears)/(AvgBulls+AvgBears)*100;
   }
   */
//----
   return(0);
  }
//+------------------------------------------------------------------+
Comments