Colored Schaff Trend
Download script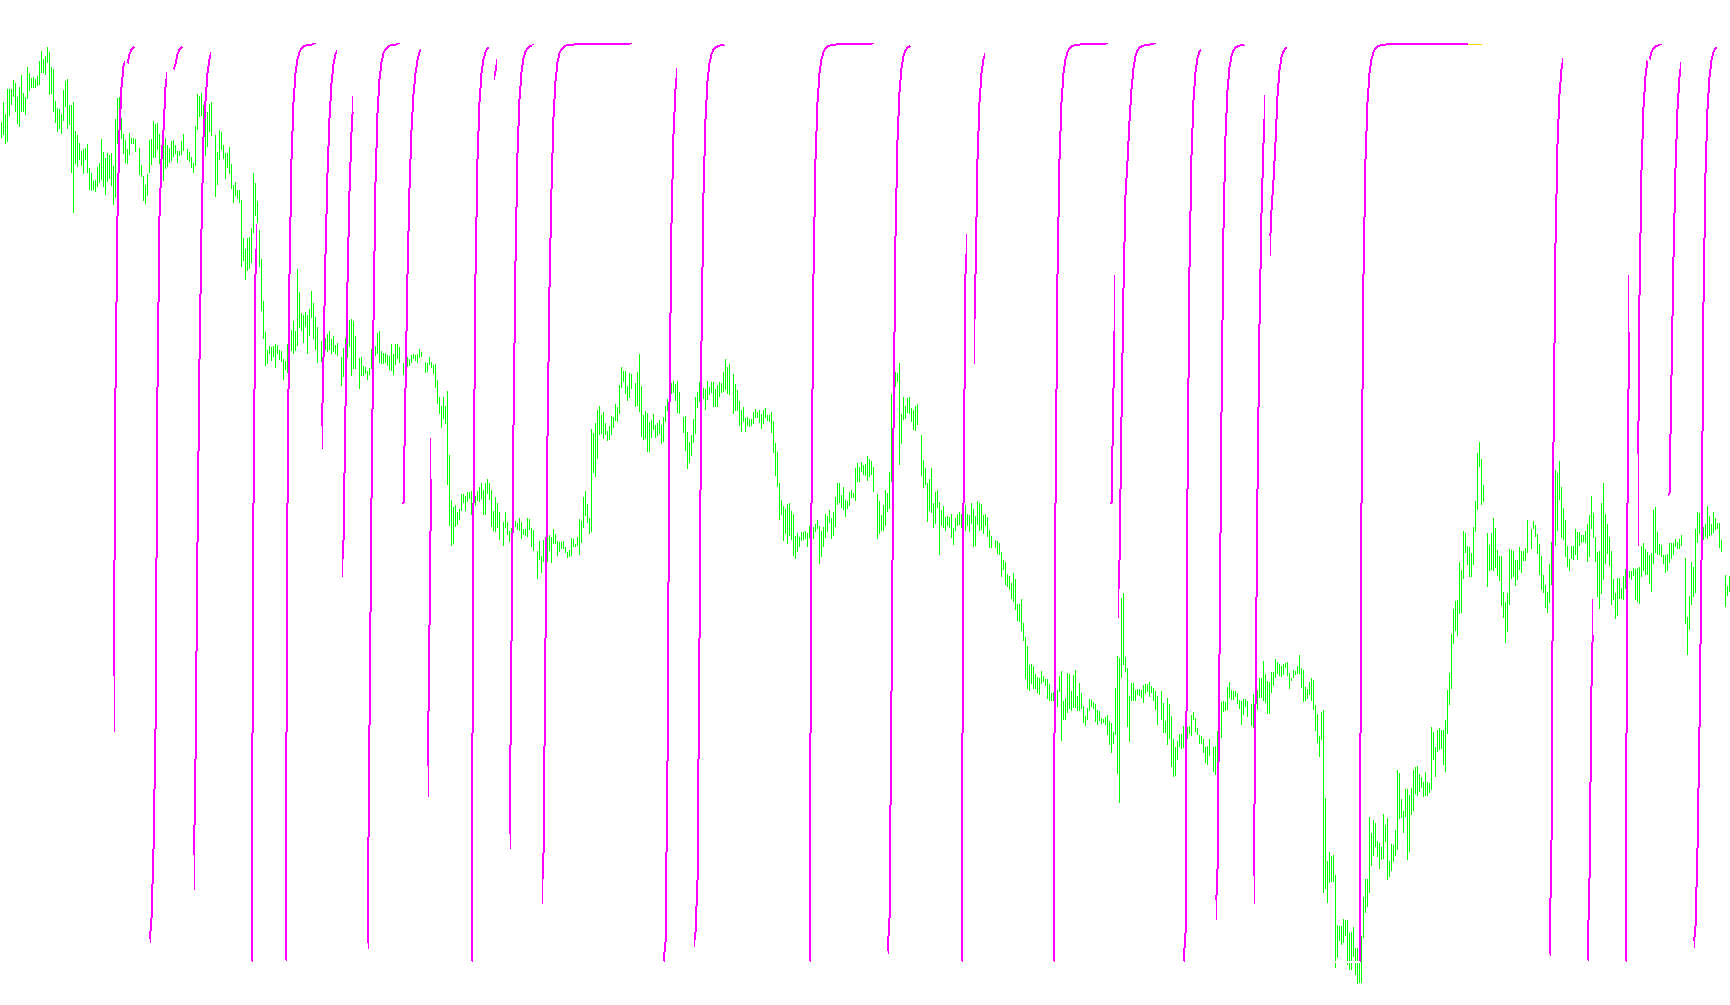
This tool is designed to provide traders with a sophisticated visual representation of market momentum and trend direction. It works by layering several mathematical filters to smooth out "noise" in price action, allowing for a clearer view of the underlying market movement.
Core Logic and Methodology
The script functions through a multi-stage calculation process. Rather than looking at price alone, it distills data into increasingly refined layers:
1. Trend Differentiation (MACD Basis) First, the tool identifies the gap between two different types of moving averages—one that reacts quickly to price changes and one that is slower and more stable. By calculating the difference between these two, the script establishes a baseline for momentum.
2. Relative Positioning (Stochastic Processing) The logic then takes that momentum data and evaluates where it sits relative to its recent high and low points. It converts this into a percentage-based scale. This helps the tool understand whether the current movement is "overextended" or still has room to grow within its current cycle.
3. Smoothing and Final Calculation (The STC) To prevent the data from being too erratic, the script applies an additional layer of smoothing. It calculates a final value—the STC—which balances the immediate changes with previous values. This results in a cleaner line that highlights the primary trend without jumping excessively at every minor price fluctuation.
Visual Feedback and Interpretation
The indicator is designed to provide clear visual cues on your trading platform:
- Dynamic Coloring: The script uses specific logic to track the direction of the STC line. When the value is increasing, it reflects a bullish (upward) trend; when the value is decreasing, it reflects a bearish (downward) trend.
- Trend Boundaries: The tool automatically identifies "peaks" and "valleys." It highlights these points to help traders see where momentum has shifted from positive to negative (or vice versa).
- Overbought and Oversold Zones: By utilizing predefined levels (set at 90 and 10), the indicator helps identify areas where the market might be reaching an extreme, potentially signaling a reversal or a cooling-off period.
By combining these layers, the script offers a refined look at market dynamics, moving beyond simple price movement to show the actual strength and direction of the trend.
//+------------------------------------------------------------------+
//|                                                    STC_COLOR.mq4 |
//+------------------------------------------------------------------+

#property indicator_separate_window
#property indicator_buffers 7
#property indicator_color1  Silver
#property indicator_color6  Lime
#property indicator_color7  Red
#property indicator_width1 2
#property indicator_width6 2
#property indicator_width7 2
//+------------------------------------------------------------------+
#property indicator_level1 90
#property indicator_level2 10
#property indicator_levelstyle DRAW_LINE
#property indicator_levelcolor MediumBlue
//+------------------------------------------------------------------+
extern int    STCPeriod    = 10;
extern int    FastMAPeriod = 23;
extern int    SlowMAPeriod = 50;
//+------------------------------------------------------------------+
double stcBuffer[];
double macdBuffer[];
double fastKBuffer[];
double fastDBuffer[];
double fastKKBuffer[];
double Upper[];
double Lower[];

//+------------------------------------------------------------------+
//| Custom indicator initialization function                         |
//+------------------------------------------------------------------+

int init()
{
   IndicatorBuffers(7);
   SetIndexBuffer(0,stcBuffer);
   SetIndexBuffer(1,macdBuffer);
   SetIndexBuffer(2,fastKBuffer);
   SetIndexBuffer(3,fastDBuffer);
   SetIndexBuffer(4,fastKKBuffer);
   SetIndexBuffer(5,Upper);
   SetIndexBuffer(6,Lower);

   SetIndexStyle(1,DRAW_NONE);
   SetIndexStyle(2,DRAW_NONE);
   SetIndexStyle(3,DRAW_NONE);
   SetIndexStyle(4,DRAW_NONE);
   SetIndexStyle(5,DRAW_LINE, EMPTY, 2);
   SetIndexStyle(6,DRAW_LINE, EMPTY, 2);

   IndicatorShortName("STC_COLOR("+STCPeriod+","+FastMAPeriod+","+SlowMAPeriod+")");
   return(0);
}

//+------------------------------------------------------------------+
//| Custom indicator deinitialization function                       |
//+------------------------------------------------------------------+

int deinit()
{
   return(0);
}

//+------------------------------------------------------------------+
//| Custom indicator iteration function                              |
//+------------------------------------------------------------------+

int start()
{
   int counted_bars=IndicatorCounted();
   int limit,i;

   if(counted_bars < 0) return(-1);
   if(counted_bars > 0) counted_bars--;
//+------------------------------------------------------------------+
      limit = Bars-counted_bars;

      for(i = limit; i >= 0; i--)
      {
         macdBuffer[i] = iMA(NULL,0,FastMAPeriod,0,MODE_EMA,PRICE_CLOSE,i)-
                         iMA(NULL,0,SlowMAPeriod,0,MODE_EMA,PRICE_CLOSE,i);
//+------------------------------------------------------------------+
         double lowMacd  = minValue(macdBuffer,i);
         double highMacd = maxValue(macdBuffer,i)-lowMacd;
            if (highMacd > 0)
                  fastKBuffer[i] = 100*((macdBuffer[i]-lowMacd)/highMacd);
            else  fastKBuffer[i] = fastKBuffer[i+1];
                  fastDBuffer[i] = fastDBuffer[i+1]+0.5*(fastKBuffer[i]-fastDBuffer[i+1]);
//+------------------------------------------------------------------+
         double lowStoch  = minValue(fastDBuffer,i);
         double highStoch = maxValue(fastDBuffer,i)-lowStoch;
            if (highStoch > 0)
                  fastKKBuffer[i] = 100*((fastDBuffer[i]-lowStoch)/highStoch);
            else  fastKKBuffer[i] = fastKKBuffer[i+1];
                  stcBuffer[i]    = stcBuffer[i+1]+0.5*(fastKKBuffer[i]-stcBuffer[i+1]);
      }
//+------------------------------------------------------------------+
   for(i = limit; i >= 0; i--)
   {
   if (stcBuffer[i] > stcBuffer[i+1]) { Upper[i] = stcBuffer[i]; Upper[i+1] = stcBuffer[i+1]; }
               else                       { Upper[i] = EMPTY_VALUE;
                                            if (Upper[i+2] == EMPTY_VALUE)
                                                Upper[i+1]  = EMPTY_VALUE; }
               if (stcBuffer[i] < stcBuffer[i+1])   { Lower[i] = stcBuffer[i]; Lower[i+1] = stcBuffer[i+1]; }
               else                       { Lower[i] = EMPTY_VALUE;
                                            if (Lower[i+2] == EMPTY_VALUE)
                                                Lower[i+1]  = EMPTY_VALUE; }
    }
//+------------------------------------------------------------------+

      return(0);
}

//+------------------------------------------------------------------+
//| ...                                          |
//+------------------------------------------------------------------+

double minValue(double& array[],int shift)
{
   double minValue = array[shift];
            for (int i=1; i<STCPeriod; i++) minValue = MathMin(minValue,array[shift+i]);
   return(minValue);
}
double maxValue(double& array[],int shift)
{
   double maxValue = array[shift];
            for (int i=1; i<STCPeriod; i++) maxValue = MathMax(maxValue,array[shift+i]);
   return(maxValue);
}
Comments