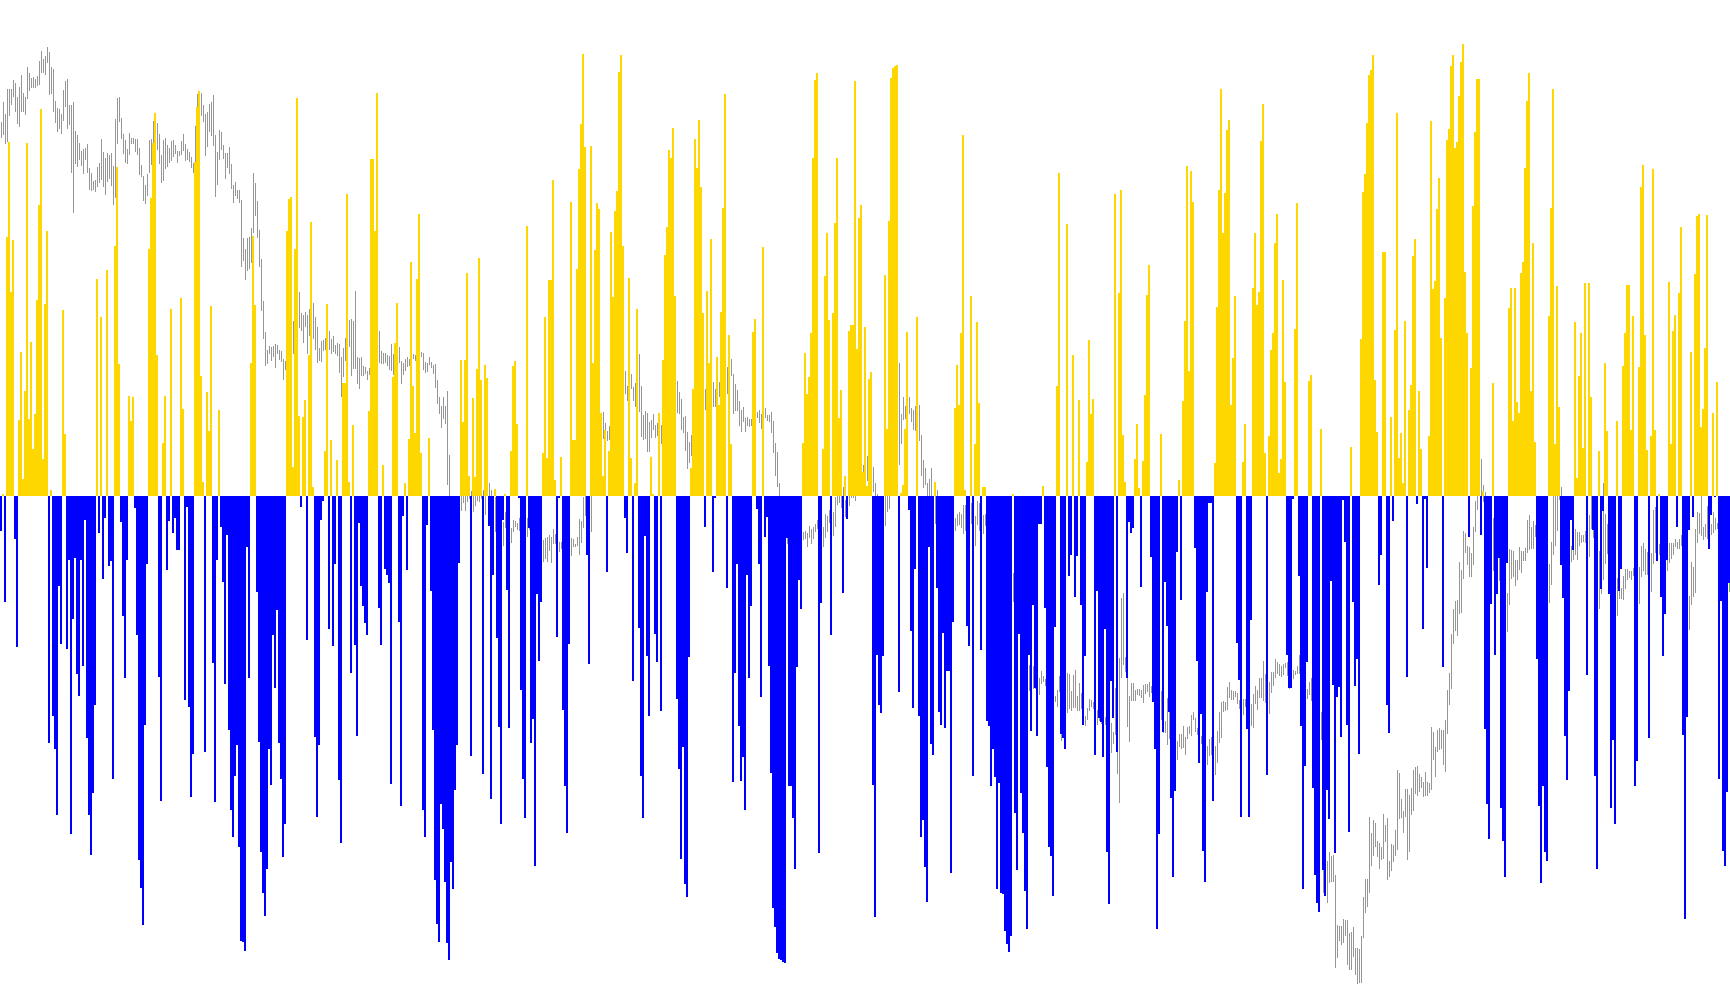
This tool is designed to provide a visual representation of market momentum by analyzing the Relative Strength Index (RSI), a common financial metric used to measure the speed and change of price movements. Instead of showing a standard line, this script transforms that data into a colored histogram that highlights whether the market is leaning toward bullish or bearish sentiment relative to a specific center point.
Core Logic and Functionality
The indicator operates based on several key mechanical steps:
1. Data Input and Calculation The script looks at price action over a user-defined number of periods (set by the RSI Periods). It calculates the RSI value, which identifies the current strength of the price trend.
2. The "Zero Line" Benchmark Unlike standard RSI indicators that typically range from 0 to 100, this script uses a middle benchmark of 50.0. It treats this number as the equilibrium point or "neutral zone." By comparing the calculated RSI against this 50.0 mark, the tool determines which direction the momentum is tilting.
3. Dynamic Color Coding The primary purpose of this indicator is to provide an instant visual cue through color changes:
- Bullish Momentum: When the RSI value rises above the benchmark of 50.0, the script activates a green histogram. This suggests that the upward momentum is currently dominant.
- Bearish Momentum: When the RSI value falls below the benchmark of 50.0, the script switches to a red histogram, indicating that downward pressure is taking over.
4. Visual Representation The script translates the mathematical difference between the RSI value and the benchmark into the height of the bars in the histogram. This allows traders to see not just the direction of the trend (via the color), but also the intensity of that move based on how far the bar extends from the center.
Summary for Users
Essentially, this tool simplifies market analysis by stripping away complex numbers and replacing them with a clear, two-color visual map. It tells you at a glance whether the current price action is "stronger" or "weaker" than average, using green to highlight upward pressure and red to highlight downward pressure relative to a central equilibrium point.
/*-----------------------------+
|			       |
| Shared by www.Aptrafx.com    |
|			       |
+------------------------------*/

//+------------------------------------------------------------------+
//|                                      ColorRSI_Histo_ZeroLine.mq4 |
//|                Copyright © 2006 , David W Honeywell , 12/12/2006 |
//|                                     HellOnWheels.Trans@gmail.com |
//+------------------------------------------------------------------+
#property copyright "Copyright © 2006 , David W Honeywell , 12/12/2006"
#property link      "HellOnWheels.Trans@gmail.com"

#property indicator_separate_window

#property indicator_buffers 2

#property indicator_color1 Green
#property indicator_color2 Red

#property indicator_maximum  50.0
#property indicator_minimum -50.0

#property indicator_level1  10
#property indicator_level2 0.0
#property indicator_level3 -10

extern int IndicatorTime =  0;
extern int RSI_Periods   = 3;
extern int Applied_Price =  0;
extern int LineWidth     =  4;

double Buffer0[];
double Buffer1[];

//+------------------------------------------------------------------+
//| Custom indicator initialization function                         |
//+------------------------------------------------------------------+
int init()
 {
//---- indicators

IndicatorBuffers(2);

SetIndexStyle(0,DRAW_HISTOGRAM,STYLE_SOLID,LineWidth);
SetIndexEmptyValue(0,0.0);
SetIndexBuffer(0,Buffer0);

SetIndexStyle(1,DRAW_HISTOGRAM,STYLE_SOLID,LineWidth);
SetIndexEmptyValue(1,0.0);
SetIndexBuffer(1,Buffer1);

IndicatorShortName(" ColorRSI_Histo_ZeroLine ( "+RSI_Periods+" ) ");

//----
  return(0);
 }
//+------------------------------------------------------------------+
//| Custom indicator deinitialization function                       |
//+------------------------------------------------------------------+
int deinit()
 {
//----

//----
  return(0);
 }
//+------------------------------------------------------------------+
//| Custom indicator iteration function                              |
//+------------------------------------------------------------------+
int start()
 {
  int     counted_bars=IndicatorCounted();
  double  StaticValue, RSIValue, Finish;
  int     i;
  int     limit;

  limit = Bars-counted_bars;
  for(i=limit; i>0; i--)
  {
     StaticValue = 50.00000000;
     RSIValue = iRSI(Symbol(),IndicatorTime,RSI_Periods,Applied_Price,i);
     Finish = (StaticValue - RSIValue)*(-1);

     if (RSIValue > StaticValue)
     {
        Buffer0[i] = Finish;
        Buffer1[i] = 0.00000000;
     }
     if (RSIValue < StaticValue)
     {
        Buffer0[i] = 0.00000000;
        Buffer1[i] = Finish;
     }
  }

//----
  return(0);
 }
//+------------------------------------------------------------------+
Comments