#CR_5_bar_reversal_v1[real][1].5
Download script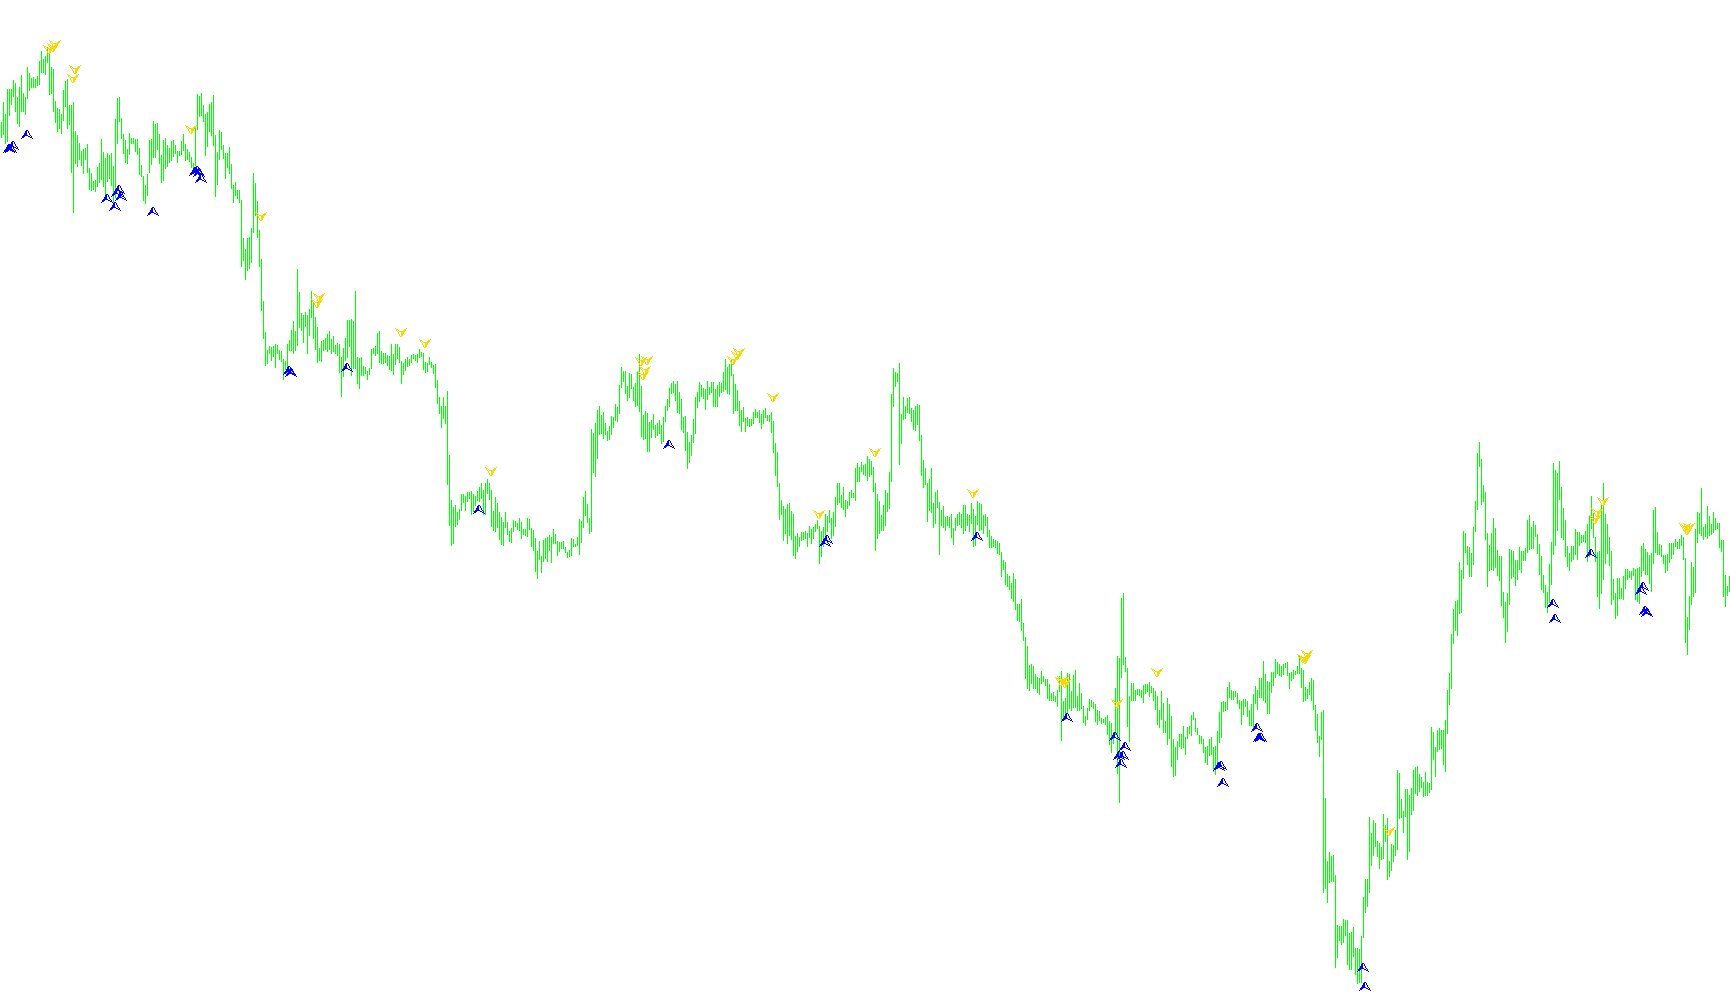
This script is a specialized technical analysis tool designed to identify specific "reversal" patterns on a trading chart by comparing current price action against historical peaks and valleys. Instead of looking at standard moving averages, it focuses on extreme price points over a rolling window of five bars.
How the Logic Works
The tool operates by constantly scanning the market history to identify two specific conditions: one for potential "Sell" opportunities and one for "Buy" opportunities. It accomplishes this by measuring the relationship between the current price and the highest highs or lowest lows of the recent past.
1. Identifying Sell Opportunities (Red Signals) The script looks for a scenario where the market appears to be losing momentum or reversing downward. It checks if:
- The highest point reached in the very recent past is significantly higher than the historical peaks found slightly further back in time.
- Simultaneously, the current closing price has dropped below the historical lows of that same period. When both of these conditions align, the script places a Red arrow on the chart to signal a potential downward reversal (Sell).
2. Identifying Buy Opportunities (Yellow Signals) Conversely, the script looks for signs that the market is底 hitting a floor and may begin to move upward. It checks if:
- The lowest point reached in the recent past is lower than the historical lows of the preceding period.
- Simultaneously, the current closing price has risen above the historical highs of that same period. When these conditions are met, the script places a Yellow arrow on the chart to signal a potential upward reversal (Buy).
Key Features
- Visual Cues: The logic translates complex mathematical comparisons into easy-to-read visual markers (Red and Yellow arrows) directly on your trading platform.
- Automated Alerts: The script includes a notification system. If the tool detects a reversal signal on the most recent price candle, it can trigger an audible alert, allowing you to react to market movements in real-time without constantly staring at the screen.
- Dynamic Scanning: Rather than looking at a fixed point in time, the logic "walks" back through the price history, calculating the highest and lowest points dynamically to ensure the signals are based on the most relevant price data available.
//+------------------------------------------------------------------+
//|                                                       5 Bars.mq4 |
//|                      Copyright © 2006, EvgeniX                   |
//|
//+------------------------------------------------------------------+
#property copyright "Copyright © 2006, EvgeniX"
#property link      "EvgeniX"

#property indicator_chart_window
#property indicator_buffers 2
#property indicator_color1 Red
#property indicator_width1 3
#property indicator_color2 Yellow
#property indicator_width2 3
//---- buffers
double ExtMapBuffer1[];
double ExtMapBuffer2[];
extern bool autorizar_alerta_red=true;
extern bool autorizar_alerta_yellow=true;
double fhigh;
double flow;
double fclose;

double shigh;
double slow;
double sclose;
double ttfn;


//+------------------------------------------------------------------+
//| Custom indicator initialization function                         |
//+------------------------------------------------------------------+
int init()
  {
//---- indicators
   SetIndexStyle(0,DRAW_ARROW,4);
   SetIndexArrow(0,218);
   SetIndexBuffer(0,ExtMapBuffer1);
   SetIndexEmptyValue(0,0.0);
   SetIndexStyle(1,DRAW_ARROW,4);
   SetIndexArrow(1,217);
   SetIndexBuffer(1,ExtMapBuffer2);
   SetIndexEmptyValue(1,0.0);
//----
   return(0);
  }
//+------------------------------------------------------------------+
//| Custor indicator deinitialization function                       |
//+------------------------------------------------------------------+
int deinit()
  {
//----

//----
   return(0);
  }
//+------------------------------------------------------------------+
//| Custom indicator iteration function                              |
//+------------------------------------------------------------------+
int start()
  {
   int    counted_bars=IndicatorCounted();
//----
  //for(int i=1  ;i<=500;i++)
  // for(int i=50000; i>=0; i--)

   // {

 int i=Bars-counted_bars;

  while(i>0)
     {

//Comment (i);

shigh=High[Highest(NULL, 0,2,5,i)];
slow=Low[Lowest(NULL,0,1,5,i)];
sclose=Close[i];

fhigh=High[Highest(NULL, 0, 2, 5, (i+5))];
flow=Low[Lowest(NULL,0,1,5,(i+5))];
fclose=Close[i+9];

//ExtMapBuffer2[i+5]=High[i]+0.0005;

//ExtMapBuffer1[i]=High[i]+0.0005;
Comment (i);
if ((shigh>fhigh) && (sclose<flow))
   {
      ExtMapBuffer1[i]=High[i+5]+0.0005;//&& !ttfn
      if (i==1&& autorizar_alerta_red==true )Alert ("5Bar Reverse  S E L L ", Symbol()," M",Period());
      //{
      //ttfn=Time[0];
      //}
   }

if ((slow<flow) && (sclose>fhigh))
   {
      ExtMapBuffer2[i]=Low[i+5]-0.0005;//&& !ttfn
      //{
      if (i==1 && autorizar_alerta_yellow==true) Alert ("5Bar Reverse  B U Y ", Symbol()," M",Period());
      //{
      //      ttfn=Time[0];
     // }
   }

//     Comment(Close[i+4]+" "+" "+DoubleToStr(i,1)+"  "+TimeToStr(Time[i],TIME_MINUTES)+
//     "\n"+" "+shigh+" "+slow+" "+sclose+
//     "\n"+" "+fhigh+" "+flow+" "+fclose);

i--;
    }


//----
   return(0);
  }
//+------------------------------------------------------------------+
Comments