dailybreakm15
Download script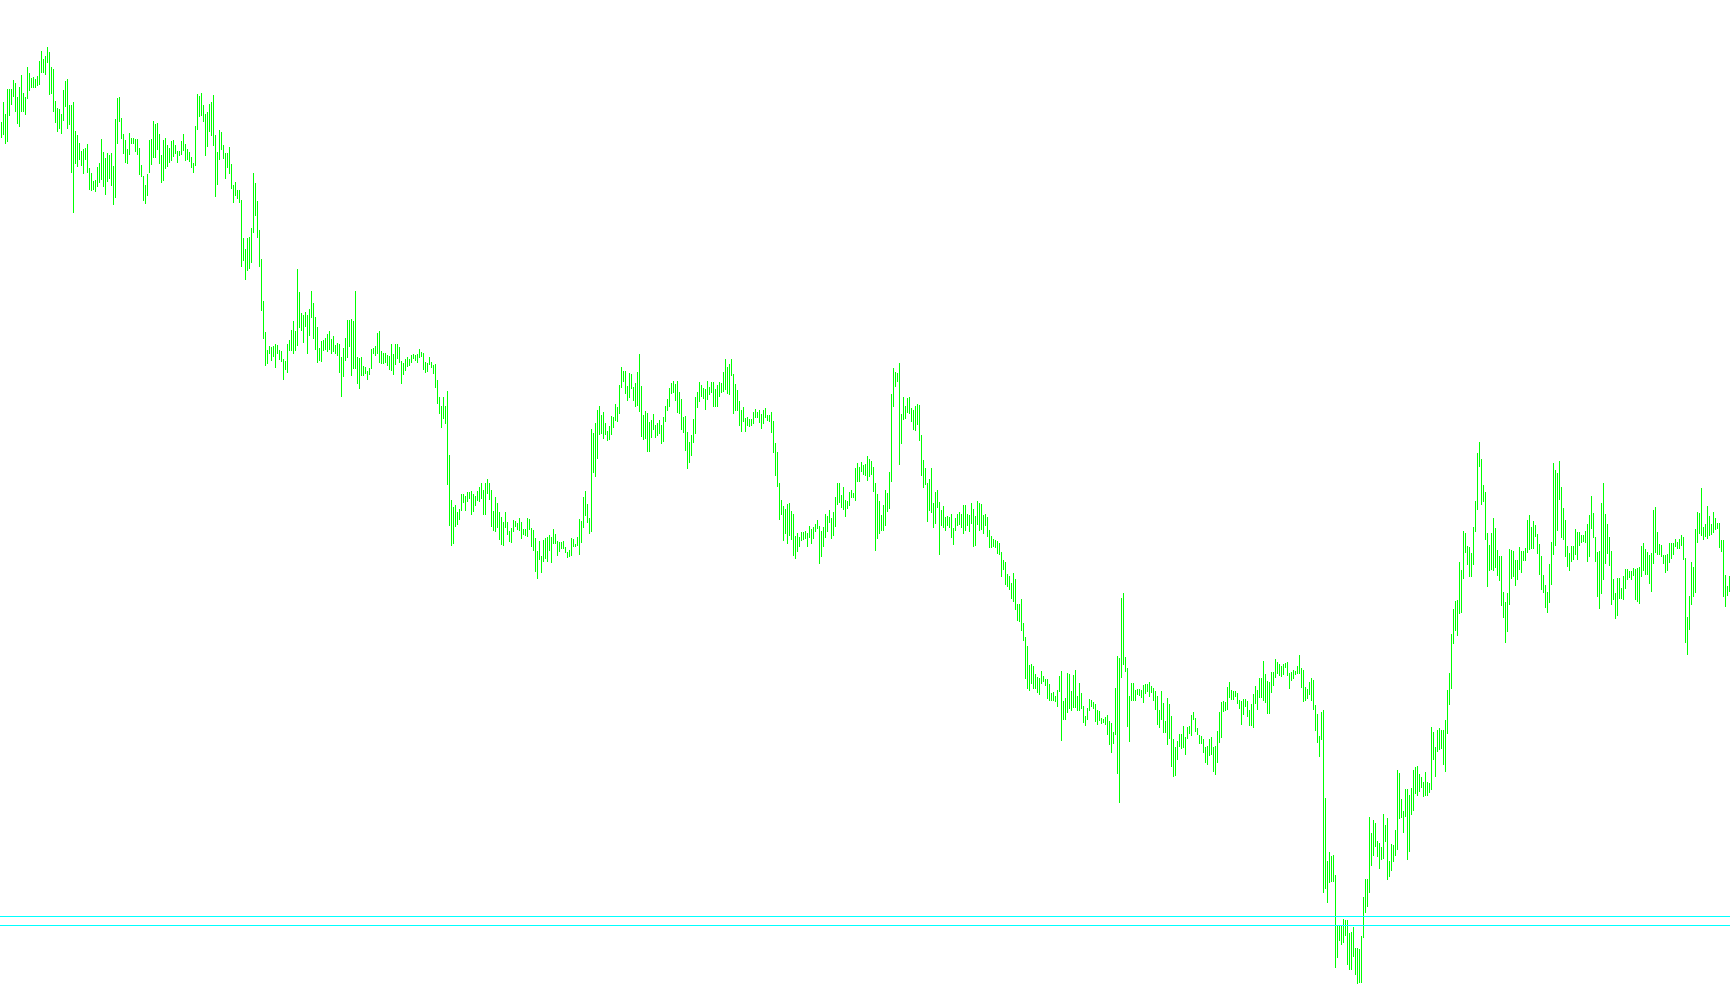
This tool is designed to provide traders with a clear visual reference of the price action occurring over a specific timeframe—specifically looking back at the last 5 days of trading. By identifying key historical boundaries, it helps traders understand where significant "breakout" levels might exist in the current market.
How the Logic Works
Data Collection The script begins by scanning the historical price data of the current asset. It looks specifically for the highest and lowest price points reached during each individual trading day over a 5-day period.
Identifying Key Boundaries Instead of just looking at yesterday, the logic systematically compares all 5 days of data to find two specific values:
- The Period High: The single highest price reached across the entire 5-day window.
- The Period Low: The single lowest price reached across the entire 5-day window.
Visual Representation Once these two extreme boundaries are calculated, the script automatically draws two horizontal lines on your trading chart:
- Upper Boundary: A solid aqua line placed at the 5-day high.
- Lower Boundary: A solid aqua line placed at the 5-day low.
Trading Context
The primary purpose of this logic is to define a "trading range." By plotting these lines, you can easily see if the current market price is trading within the previous week's boundaries or if it has broken out above or below them. It simplifies the process of spotting high-volatility movements where the price moves beyond the established limits of the past several days.
//+------------------------------------------------------------------+
//|                                                 5dayBreakout.mq4 |
//|                                                        Bill Sica |
//|                                         http://www.tetsuyama.com |
//+------------------------------------------------------------------+
#property copyright "Bill Sica"
#property link      "http://www.tetsuyama.com"

#property indicator_chart_window
//---- input parameters
extern int       DAYS=5;
//+------------------------------------------------------------------+
//| Custom indicator initialization function                         |
//+------------------------------------------------------------------+

int init()
  {
//---- indicators

//---- indicators


//----
   return(0);
  }

//+------------------------------------------------------------------+
//| Custom indicator iteration function                              |
//+------------------------------------------------------------------+
int start()
  {
   double daily_high[20];
   double daily_low[20];
   double yesterday_close;
   double phigh,plow;
   int i=1;

//---- TODO: add your code here
ArrayResize(daily_high,DAYS);
ArrayResize(daily_low,DAYS);
ArrayInitialize(daily_high,0);
ArrayInitialize(daily_low,0);

ArrayCopySeries(daily_low, MODE_LOW, Symbol(), PERIOD_M15);
ArrayCopySeries(daily_high, MODE_HIGH, Symbol(), PERIOD_M15);

/* initialise */
plow=daily_low[1];
phigh=daily_high[1];

for(i=1;i<DAYS;i++)
{
   if(plow>daily_low[i])
   {
      plow =daily_low[i];
   }
}

for(i=1;i<DAYS;i++)
{
   if(phigh<daily_high[i])
   {
      phigh =daily_high[i];
   }
}

Comment("\n5dayH ",phigh,"\n5dayL ",plow);

ObjectDelete("5dayHigh");
ObjectDelete("5dayLow");

ObjectCreate("5dayHigh", OBJ_HLINE,0, CurTime(),phigh);
ObjectSet("5dayHigh",OBJPROP_COLOR,Aqua);
ObjectSet("5dayHigh",OBJPROP_STYLE,STYLE_SOLID);

ObjectCreate("5dayLow", OBJ_HLINE,0, CurTime(),plow);
ObjectSet("5dayLow",OBJPROP_COLOR,Aqua);
ObjectSet("5dayLow",OBJPROP_STYLE,STYLE_SOLID);

ObjectsRedraw();

   return(0);
  }
//+------------------------------------------------------------------
Comments