DailyBreakout
Download script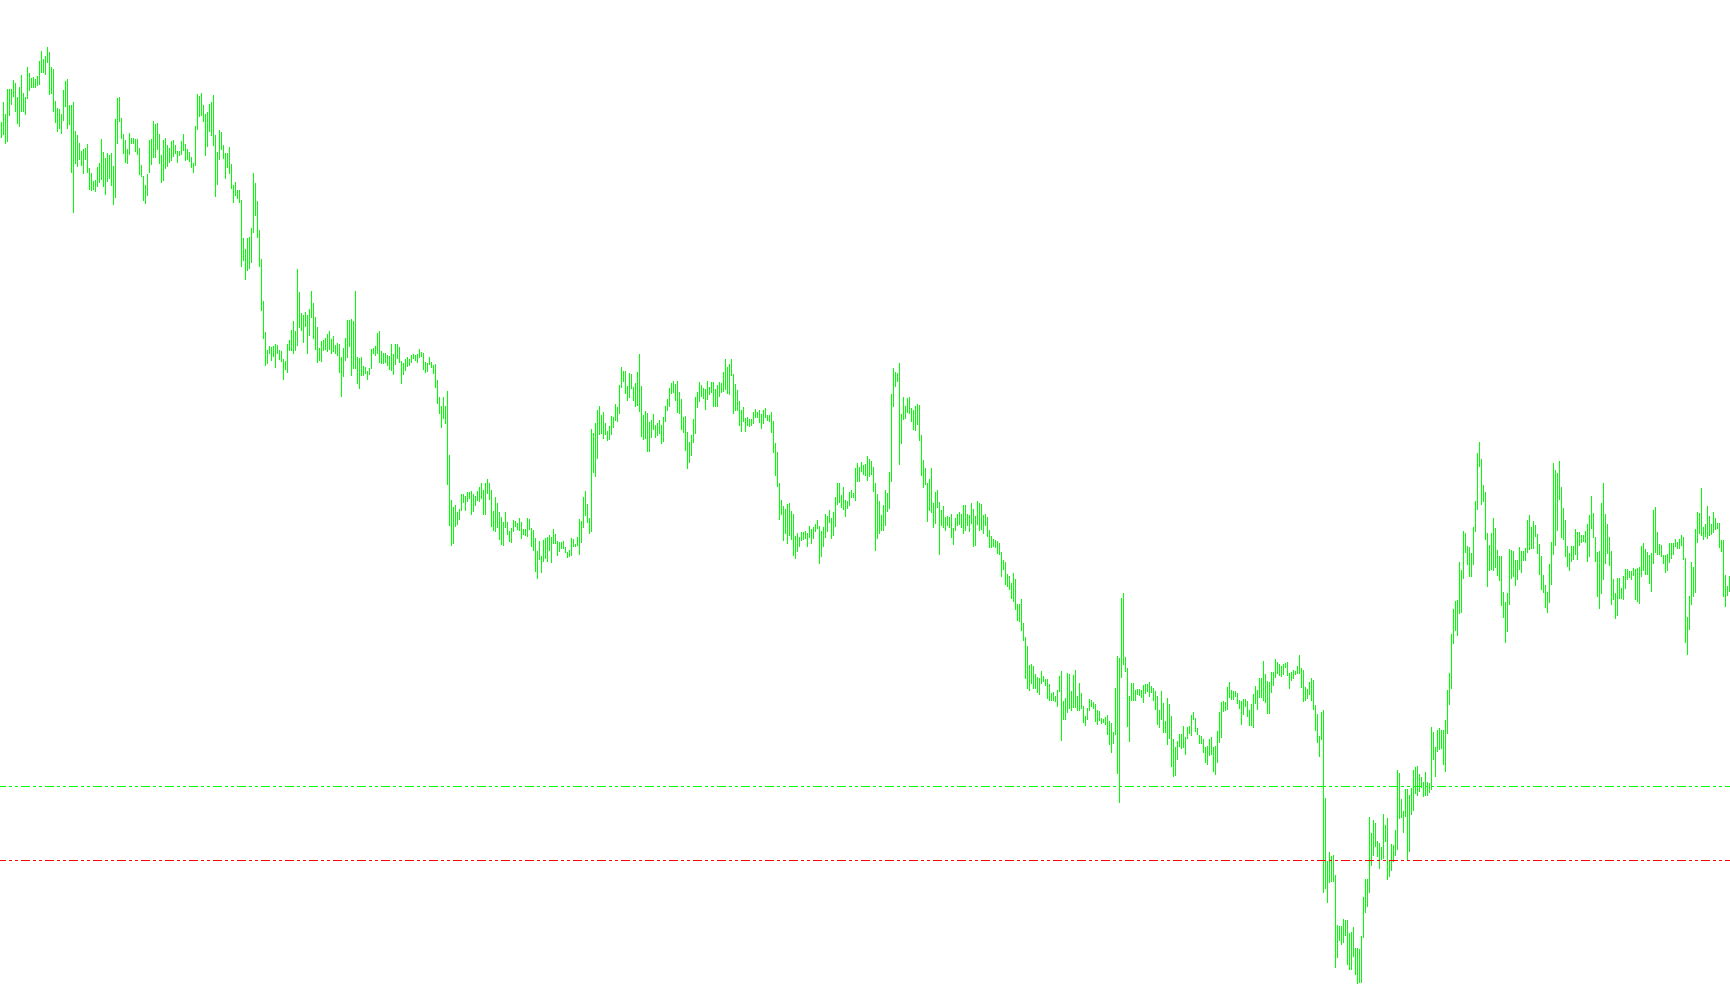
This tool is designed for traders who want to monitor key price levels based on previous market activity. Its primary purpose is to identify the highest and lowest points reached during the previous trading day and project those levels onto the current chart.
Core Functionality
The script automatically analyzes historical price data to determine two critical boundaries:
- Resistance Level (R1): This represents the highest price reached during the previous day.
- Support Level (S1): This represents the lowest price reached during the previous day.
By identifying these "pivots," the tool helps traders see where the market struggled to break out upward or downward in the past, providing a visual roadmap of potential turning points for the current session.
Visual Elements
To make this information easy to read at a glance, the script performs the following actions on your chart:
- Dynamic Drawing: It automatically draws two horizontal lines across your screen—one for Support and one for Resistance.
- Color Coding: To differentiate between the two, the script uses distinct colors (typically Lime for Resistance and Red for Support), making it easy to identify which level is which.
- Labels: It places text labels on the chart so you can clearly see the "R1" and "S1" designations.
Alert System
Beyond just providing visual cues, the script includes an intelligent notification system. You can configure it to send a real-time alert (audible sound and pop-up message) when the current market price approaches or crosses these key levels:
- Breakout Detection: It monitors how close the current price is to the R1 and S1 lines.
- Smart Filtering: To prevent the system from spamming multiple notifications for a single move, it uses "first-time" logic. This ensures you are only notified at the moment the price enters the breakout zone, rather than being alerted on every subsequent tick of movement.
- Customizable Sensitivity: The tool allows you to define exactly how many "pips" away from the line a price must be to trigger the alert, giving you control over how sensitive the system is to price fluctuations.
Usage Requirements
For the logic to function accurately, the tool is optimized for intraday viewing. It is designed to be used on charts with timeframes of 4 hours or less, as this ensures the script has a sufficient amount of data to calculate the daily highs and lows correctly.
//+------------------------------------------------------------------+
//|                                                DailyBreakout.mq4 |
//|                                   Copyright © 2008, Robert Hill. |
//+------------------------------------------------------------------+
#property copyright "Copyright © 2008, Robert Hill"
#property link      "NONE"

#property indicator_chart_window
//---- input parameters
extern bool Alerts = false;
extern int  GMTshift = 0;
extern int LabelShift = 20;
extern int LineShift = 40;
extern string  pd = "PipsAboveBelowSR for Alert";
extern int PipDistance = 1;
extern color StandardFontColor = White;
extern int StandardFontSize = 8;
extern color SupportColor = Red;
extern color ResistanceColor = Lime;

datetime LabelShiftTime, LineShiftTime;

double yesterday_high=0;
double yesterday_low=0;
double LastHigh,LastLow,x;
double R1=0;
double S1=0;
bool firstS1=true;
bool firstR1=true;
double myPoint;


//+------------------------------------------------------------------+
//| Custom indicator initialization function                         |
//+------------------------------------------------------------------+
int init()
  {
//---- indicators
     myPoint = SetPoint(Symbol());
//----
   return(0);
  }
//+------------------------------------------------------------------+
//| Custor indicator deinitialization function                       |
//+------------------------------------------------------------------+
int deinit()
  {
//---- TODO: add your code here
//----
ObjectDelete("R1 Label");
ObjectDelete("R1 Line");
ObjectDelete("S1 Label");
ObjectDelete("S1 Line");

   return(0);
  }

double SetPoint(string mySymbol)
{
   double mPoint, myDigits;

   myDigits = MarketInfo (mySymbol, MODE_DIGITS);
   if (myDigits < 4)
      mPoint = 0.01;
   else
      mPoint = 0.0001;

   return(mPoint);
}

int DoAlerts()
{
   double DifAboveR1,PipsLimit;
   double DifBelowS1;

   DifBelowS1 = S1 - Close[0];
   DifAboveR1 = Close[0] - R1;
   PipsLimit = PipDistance * myPoint;

   if (DifBelowS1 > PipsLimit) firstS1 = true;
   if (DifBelowS1 <= PipsLimit && DifBelowS1 > 0)
   {
    if (firstS1)
    {
      Alert("Below S1 Line by ",DifBelowS1, " for ", Symbol(),"-",Period());
      PlaySound("alert.wav");
      firstS1=false;
    }
   }

   if (DifAboveR1 > PipsLimit) firstR1 = true;
   if (DifAboveR1 <= PipsLimit && DifAboveR1 > 0)
   {
    if (firstR1)
    {
      Alert("Above R1 Line by ",DifAboveR1," for ", Symbol(),"-",Period());
      Sleep(2000);
      PlaySound("timeout.wav");
      firstR1=false;
    }
   }

}


//+------------------------------------------------------------------+
//| Custom indicator iteration function                              |
//+------------------------------------------------------------------+
int start()
  {
   int    counted_bars=IndicatorCounted();
//---- TODO: add your code here

double day_high=0;
double day_low=0;
double yesterday_open=0;
double today_open=0;
double cur_day=0;
double prev_day=0;

int cnt=720;

//---- exit if period is greater than 4 hr charts
if(Period() > 240)
{
Print("Error - Chart period is greater than 4 hr.");
return(-1); // then exit
}

//---- Get new daily prices & calculate pivots
 cur_day=0;
 prev_day=0;


//---- Get new daily prices & calculate pivots

while (cnt!= 0)
{
	cur_day = TimeDay(Time[cnt]- (GMTshift*3600));

	if (prev_day != cur_day)
	{
		yesterday_high = day_high;
		yesterday_low = day_low;

		day_high = High[cnt];
		day_low  = Low[cnt];

		prev_day = cur_day;
	}

   if (High[cnt]>day_high)
   {
      day_high = High[cnt];
   }
   if (Low[cnt]<day_low)
   {
      day_low = Low[cnt];
   }

	cnt--;

}


S1 = yesterday_low;
R1 = yesterday_high;

LabelShiftTime = Time[LabelShift];
LineShiftTime = Time[LineShift];
//---- Set line labels on chart window

      DisplayLabel("R1 label", "R1", R1, StandardFontSize, StandardFontColor);
      DisplayLabel("S1 label", "S1", S1, StandardFontSize, StandardFontColor);

//---  Draw  Pivot lines on chart

      DisplayLine("S1 line", S1, 0, STYLE_DASHDOTDOT, SupportColor);
      DisplayLine("R1 line", R1, 0, STYLE_DASHDOTDOT, ResistanceColor);

//---- done
   // Now check for Alert

   if (Alerts) DoAlerts();

//----
   return(0);
  }

//---- Set line labels on chart window
void DisplayLabel(string LabelName, string LabelText, double LabelPos, int LabelFontSize, color LabelColor)
{
      if(ObjectFind(LabelName) != 0)
      {
        ObjectCreate(LabelName, OBJ_TEXT, 0, LabelShiftTime, LabelPos);
        ObjectSetText(LabelName, LabelText, LabelFontSize, "Arial", LabelColor);
      }
      else
      {
        ObjectMove(LabelName, 0, LabelShiftTime, LabelPos);
      }
}

//---  Draw  Pivot lines on chart
void DisplayLine(string LineName, double LinePos, int LineWidth, int LineStyle, color LineColor)
{
      if(ObjectFind(LineName) != 0)
      {
      ObjectCreate(LineName, OBJ_HLINE, 0, LineShiftTime, LinePos);
      ObjectSet(LineName, OBJPROP_STYLE, LineStyle);
      ObjectSet(LineName, OBJPROP_COLOR, LineColor);
      if (LineWidth > 0) ObjectSet(LineName, OBJPROP_WIDTH, LineWidth);
      }
      else
      {
      ObjectMove(LineName, 0, LineShiftTime, LinePos);
      }
}
//+------------------------------------------------------------------+
Comments