Damiani_Volt
Download script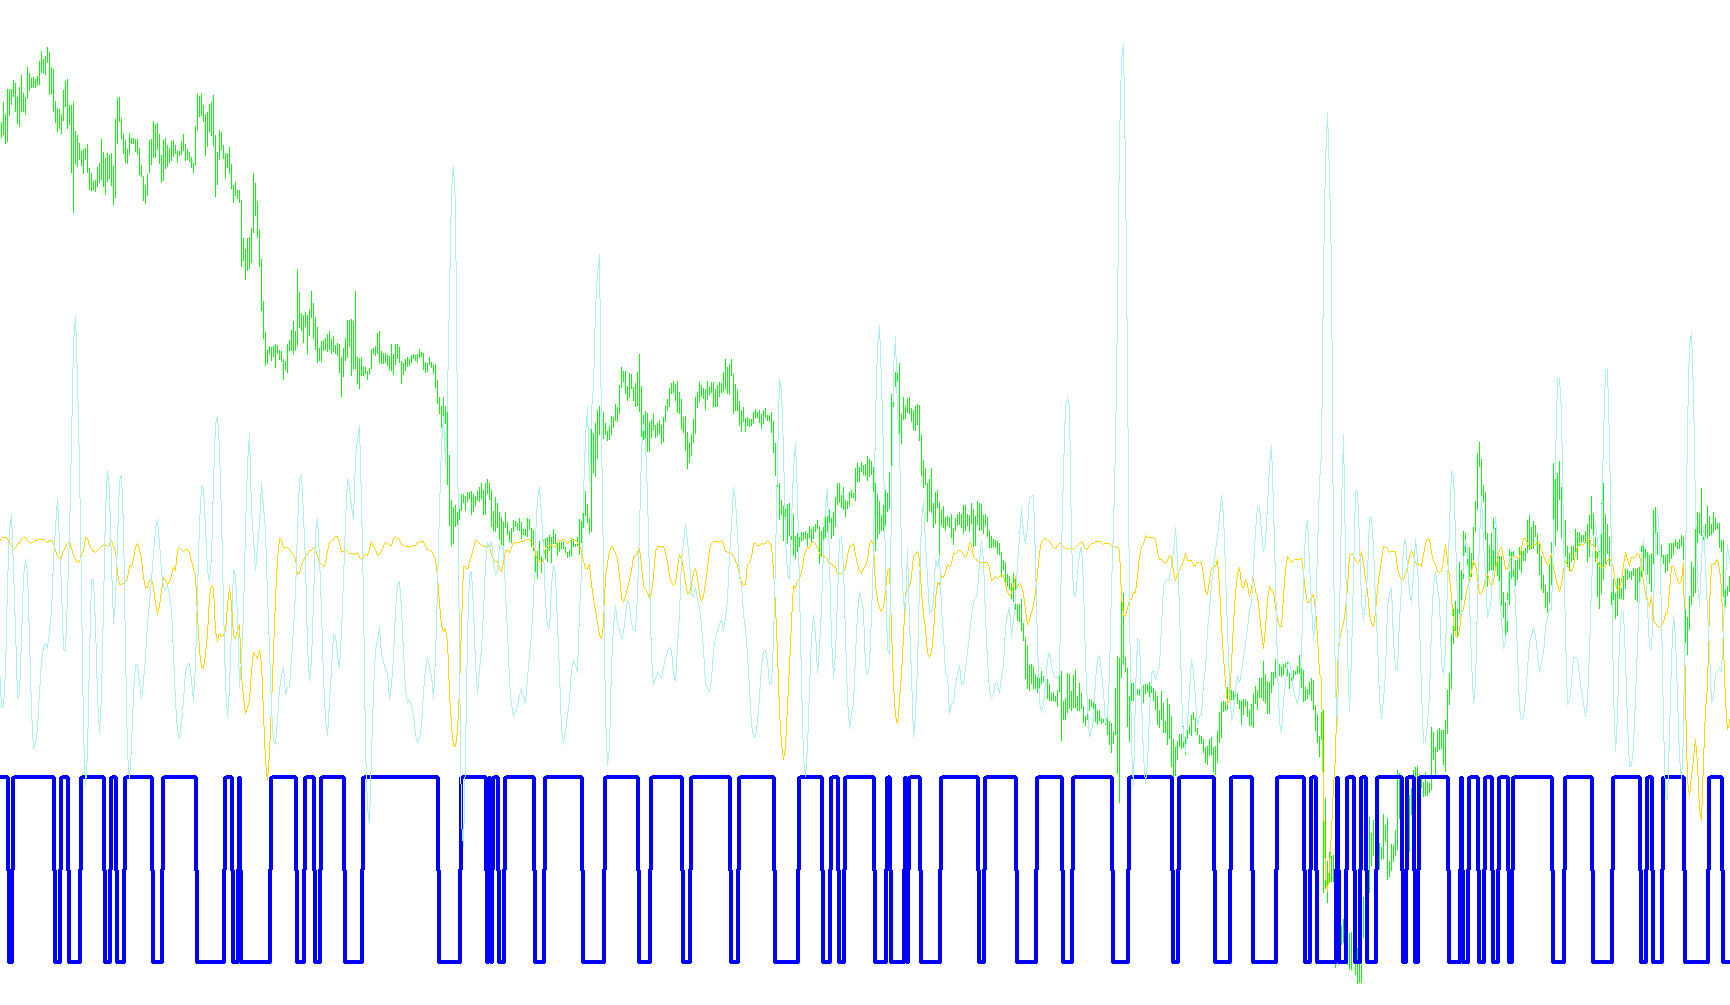
This script is designed as a technical analysis tool for the MetaTrader platform, primarily used to help traders identify specific market conditions where volatility may be high enough to warrant taking a trade. It operates by comparing short-term market fluctuations against long-term historical averages to filter out "noise" and highlight significant movements.
Core Logic and Functionality
The tool works by calculating two primary metrics simultaneously:
1. Volatility Analysis (Activity Level) The script looks at the Average True Range (ATR), which measures how much a price moves on average over a specific period. It compares a "fast" (short-term) volatility measurement against a "slow" (long-term) baseline.
- Lag Suppression: There is an optional feature that smooths out these calculations to prevent the indicator from reacting too quickly or sluggishly to minor price flickers, ensuring the data remains relevant to current market conditions.
2. Standard Deviation Analysis (Stability Level) In tandem with volatility, the script calculates the Standard Deviation, which measures how much the price is deviating from its average path. By comparing the short-term deviation to a long-term standard, the script establishes a "threshold" or a benchmark for what constitutes a normal move versus an exceptional one.
How It Signals to the User
The indicator creates a visual environment on your chart to help you make decisions:
- The Threshold Line: The script draws a baseline (Threshold) on a separate window. This represents the "entry requirement."
- Real-Time Comparison: On every new price tick, the script calculates the current adjusted volatility and compares it against the calculated threshold.
- Visual Feedback:
- When the volatility exceeds the threshold, the indicator identifies a potential trading opportunity.
- When the volatility stays below the threshold, it suggests that market movement is currently too low or insignificant to be considered an active trade signal.
- Dynamic Labeling: The script provides a clear text readout on your screen, explicitly stating "TRADE" or "DO NOT trade" based on whether the current mathematical conditions have met the user-defined requirements.
Summary for the Trader
Essentially, this tool acts as a filter. Instead of reacting to every small wiggle in the price, it waits for moments where short-term volatility breaks through a specific mathematical barrier relative to history. It tells you when the market is "moving enough" to be worth your attention while keeping you out of sideways or stagnant markets.
#property copyright "Copyright © 2006,2007 Luis Guilherme Damiani"
#property link      "http://www.damianifx.com.br"

#property indicator_separate_window
#property indicator_minimum 0.0
#property indicator_buffers 3
#property indicator_color1 Silver
#property indicator_color2 Magenta
#property indicator_color3 Lime

extern int Vis_atr = 5;
extern int Vis_std = 8;
extern int Sed_atr = 40;
extern int Sed_std = 100;
extern double Threshold_level = 1.4;
extern bool lag_supressor = TRUE;
double Buff_X = 0.5;

double BufferA[];
double BufferB[];
double BufferC[];

int init() {
   SetIndexStyle(0, DRAW_LINE);
   SetIndexBuffer(0, BufferA);
   SetIndexStyle(1, DRAW_LINE, STYLE_SOLID, 4);
   SetIndexBuffer(1, BufferB);
   SetIndexStyle(2, DRAW_LINE);
   SetIndexBuffer(2, BufferC);
   return (0);
}

int deinit() {
   return (0);
}

int start() {
   int countedbar;
   double atr;
   double Buff_1;
   double Buff_2;
   double ATR_value;
   double std;
   double ATD_value;
   double T_Level;
   double atr_2 = 0;
   int countted = IndicatorCounted();
   if (countted < 0) return (-1);
   if (countted > 0) countted--;
   int barcount = Bars - countted;
   int atrstd = MathMax(Sed_atr, Sed_std);
   if (barcount > atrstd + 5) countedbar = barcount - atrstd;
   else countedbar = barcount;
   for (int i = countedbar; i >= 0; i--) {
      atr = iATR(NULL, 0, Vis_atr, i);
      Buff_1 = BufferC[i + 1];
      Buff_2 = BufferC[i + 3];
      ATR_value = NormalizeDouble(atr, Digits);
      if (lag_supressor) atr_2 = atr / iATR(NULL, 0, Sed_atr, i) + Buff_X * (Buff_1 - Buff_2);
      else atr_2 = atr / iATR(NULL, 0, Sed_atr, i);
      std = iStdDev(NULL, 0, Vis_std, 0, MODE_LWMA, PRICE_TYPICAL, i);
      ATD_value = NormalizeDouble(std, Digits);
      std /= iStdDev(NULL, 0, Sed_std, 0, MODE_LWMA, PRICE_TYPICAL, i);
      T_Level = Threshold_level;
      T_Level -= std;
      if (i == 0) {
         if (atr_2 > T_Level) {
            IndicatorShortName("TRADE " + " A(" + DoubleToStr(Vis_atr, 0) + "/" + DoubleToStr(Sed_atr, 0) + ")= " + DoubleToStr(atr_2, 2) + ", " + DoubleToStr(Threshold_level, 1) +
               " - S(" + DoubleToStr(Vis_std, 0) + "/" + DoubleToStr(Sed_std, 0) + ")= " + DoubleToStr(T_Level, 2) + " ");
         } else {
            IndicatorShortName("DO NOT trade " + "A(" + DoubleToStr(Vis_atr, 0) + "/" + DoubleToStr(Sed_atr, 0) + ")= " + DoubleToStr(atr_2, 2) + ", " + DoubleToStr(Threshold_level, 1) +
               " - S(" + DoubleToStr(Vis_std, 0) + "/" + DoubleToStr(Sed_std, 0) + ")= " + DoubleToStr(T_Level, 2) + " ");
         }
      }
      if (atr_2 > T_Level) {
         BufferC[i] = atr_2;
         BufferB[i] = -1;
      } else {
         BufferC[i] = atr_2;
         BufferB[i] = 0.03;
      }
      BufferA[i] = T_Level;
   }
   return (0);
}
Comments