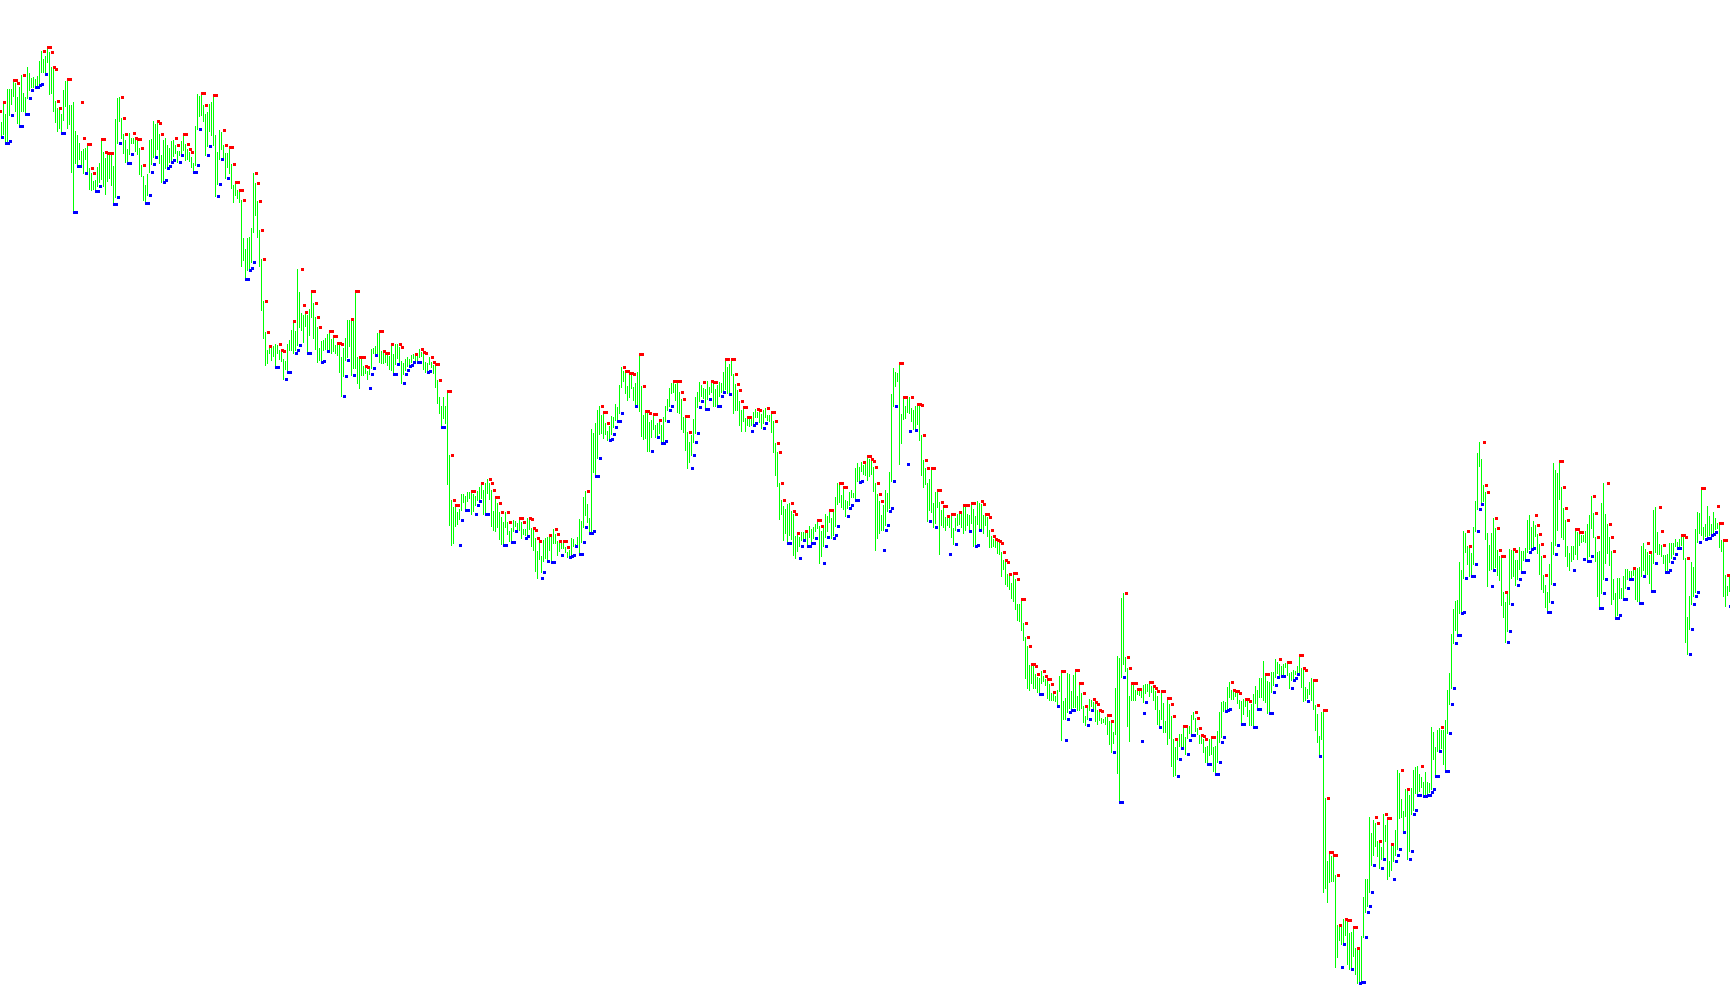
Overview of the Darma System Indicator
The Darma System is a technical analysis tool designed to help traders identify potential entry points for "Buy" and "Sell" positions by monitoring specific shifts in market sentiment and price action. It translates complex mathematical movements into visual cues—specifically colored bars and dots—to signal when the market "mood" is shifting in a favorable direction.
Core Visual Components
The indicator utilizes two primary visual elements on your chart:
- Dots (Sentiment Signals): These represent the immediate underlying "mood" of the market. A Blue Dot appearing below the price suggests a bullish sentiment, while a Red Dot appearing above the price suggests a bearish sentiment.
- Bars (Confirmation Signals): These are larger visual markers that confirm the momentum described by the dots. A Blue Bar confirms a potential buy opportunity, and a Red Bar confirms a potential sell opportunity.
Trading Logic & Rules
The system follows a specific sequence of events to filter out market noise and identify high-probability trades:
For Buy Positions:
- Sentiment Shift: The first signal occurs when a Red Dot (located above the price) flips to a Blue Dot (located below the price). This indicates that the market mood is shifting toward an upward trend.
- Confirmation: Once the sentiment shifts, you must wait for the price bar itself to turn Blue. Note that this transition may happen instantly or require a few moments of price movement.
- Execution: You should wait for that specific Blue Bar to close completely. Once confirmed, the entry is placed 10–15 pips above the high point of that closing Blue Bar.
For Sell Positions:
- Sentiment Shift: The initial signal occurs when a Blue Dot (located below the price) flips to a Red Dot (located above the price). This indicates the market mood is turning downward.
- Confirmation: After this shift, you wait for the price bar to turn Red.
- Execution: You must wait for the Red Bar to close fully. The entry is then placed 10–15 pips below the low point of that closing Red Bar.
Summary for the User
Essentially, this indicator acts as a two-step filter. The Dots tell you what the market "feels" like right now, and the Bars tell you if that feeling has enough momentum to actually move the price. By waiting for the bar to close before entering, the system aims to ensure that the trend has been validated by actual price action rather than just a temporary fluctuation.
//+------------------------------------------------------------------+
//|                                Darma System Indicator (beta).mq4 |
//|                                                tonyc2a@yahoo.com |
//|                                                                  |
//+------------------------------------------------------------------+
/*README
   This indicator is supposed to be a conversion of Darma's set of indicators from MT3 to MT4.
   This conversion is not exactly the same though. In the MT3 version, the indicators were split up between 4 separate custom indicator files.
   This MT4 version has all the logic combined into one file. Due to this consolidation, some of the logic did not translate exactly as intended.
   Also, I only did a direct code translation. Prior to looking at the code in the MT3 files, I had no understanding of the logic behind the indicator files.
   If someone could provide the logic in human language, I might be able to make this indicator behave more properly as well as be a little more programmatically elegant.
   Test this indicator out according to Darma's original rules and see how it does for you.

   Darma's Rules:
   BUY:
   1. When red stop dot (above price) becoming a blue stop dot (below price), the mood is ready for a buy.
   3. Wait for the bar becoming blue. Sometime it happens in the same time, but sometime need to wait.
   4. After you have a blue bar, Wait that blue bar closed completely.
   5. Then place order to buy at 10-15 pips above the high of that blue bar.

   SELL:
   1. When bule stop dot (below price) becoming a red stop dot (above price), the mood is ready for a sell.
   3. Wait for the bar becoming red. Sometime it happens in the same time, but sometime need to wait.
   4. After you have a red bar, Wait that red bar closed completely.
   5. Then place order to sell at 10-15 pips below the low of that red bar.

   PS. This code is very ugly and inelegant. I would like to fix this by getting system rules in english.

   - tonyc2a@yahoo.com
*/
#property copyright "tonyc2a@yahoo.com"
#property link      ""

#property indicator_chart_window
#property indicator_buffers 4

//---- input parameters
extern int WingDings_Symbol = 158;

//---- buffers
double Buffer1[];
double Buffer2[];
double Buffer3[];
double Buffer4[];
double Buffer5[];
double Buffer6[];

//+------------------------------------------------------------------+
//| Custom indicator initialization function                         |
//+------------------------------------------------------------------+
int init()
  {
//---- indicators
   SetIndexStyle(0,DRAW_HISTOGRAM,STYLE_SOLID,2,Blue);
   SetIndexBuffer(0,Buffer1);
   SetIndexLabel(0,"Blue Bar");
   SetIndexStyle(1,DRAW_HISTOGRAM,STYLE_SOLID,2,Red);
   SetIndexBuffer(1,Buffer2);
   SetIndexLabel(1,"Red Bar");
   SetIndexStyle(2,DRAW_ARROW,STYLE_DOT,2,Blue);
   SetIndexBuffer(2,Buffer3);
   SetIndexLabel(2,"Blue Dot");
   SetIndexArrow(2,WingDings_Symbol);
   SetIndexStyle(3,DRAW_ARROW,STYLE_DOT,2,Red);
   SetIndexBuffer(3,Buffer4);
   SetIndexLabel(3,"Red Dot");
   SetIndexArrow(3,WingDings_Symbol);
   //SetIndexStyle(4,DRAW_SECTION,STYLE_SOLID,1,Blue);
   //SetIndexBuffer(4,Buffer5);
   //SetIndexLabel(4,"Blue");
   //SetIndexStyle(5,DRAW_SECTION,STYLE_SOLID,1,Red);
   //SetIndexBuffer(5,Buffer6);
   //SetIndexLabel(5,"Red");

//----
   return(0);
  }
//+------------------------------------------------------------------+
//| Custor indicator deinitialization function                       |
//+------------------------------------------------------------------+
int deinit()
  {
//---- TODO: add your code here

//----
   return(0);
  }
//+------------------------------------------------------------------+
//| Custom indicator iteration function                              |
//+------------------------------------------------------------------+
int start()
  {
   int    counted_bars=IndicatorCounted();
//---- TODO: add your code here
      int adjustment=0; //change this value to make the indicator behave slightly differently. valid values are 0-4.
      int periods=3;
      int extremes=0;
      double smin, smax, SsMax, SsMin, pivothi, pivotlo, margins;
      bool flag1, flag2;

      for(int i=0;i<Bars;i++){
         if(extremes!=0){
            SsMax = High[Highest(NULL,0,MODE_OPEN,periods,i+adjustment)];
            SsMin = Low[Lowest(NULL,0,MODE_OPEN,periods,i+adjustment)];
            }
         else{
            SsMax = Open[Highest(NULL,0,MODE_OPEN,periods,i+adjustment)];
            SsMin = Open[Lowest(NULL,0,MODE_OPEN,periods,i+adjustment)];
            }
         smin = SsMin+(SsMax-SsMin)*margins/100;
	      smax = SsMax-(SsMax-SsMin)*margins/100;
         pivothi=((2*High[i])+Low[i]+(2*Close[i]))/5;
         pivotlo=(High[i]+(2*Low[i])+(2*Close[i]))/5;
         if(pivotlo>smin && pivothi>smax) flag1=true; else flag1=false;
         if(pivothi<smax && pivotlo<smin) flag2=true; else flag2=false;

         if(flag1){
            //Buffer1[i]=High[i];
            //Buffer2[i]=Low[i];
            }
         if(flag2){
            //Buffer1[i]=Low[i];
            //Buffer2[i]=High[i];
            }

         double sig=iSAR(NULL,0,0.5,1,i);
         if(sig<Low[i]) Buffer3[i]=sig;
         if(sig>High[i]) Buffer4[i]=sig;

         /*
         double sig2=iSAR(NULL,0,1,0.2,i);
         if(sig2<Low[i]) {Buffer5[i]=sig2; Buffer6[i]=-1;}
         if(sig2>High[i]) {Buffer6[i]=sig2; Buffer5[i]=-1;}
         */

         }//end for
//----
   return(0);
  }
//+------------------------------------------------------------------+
Comments