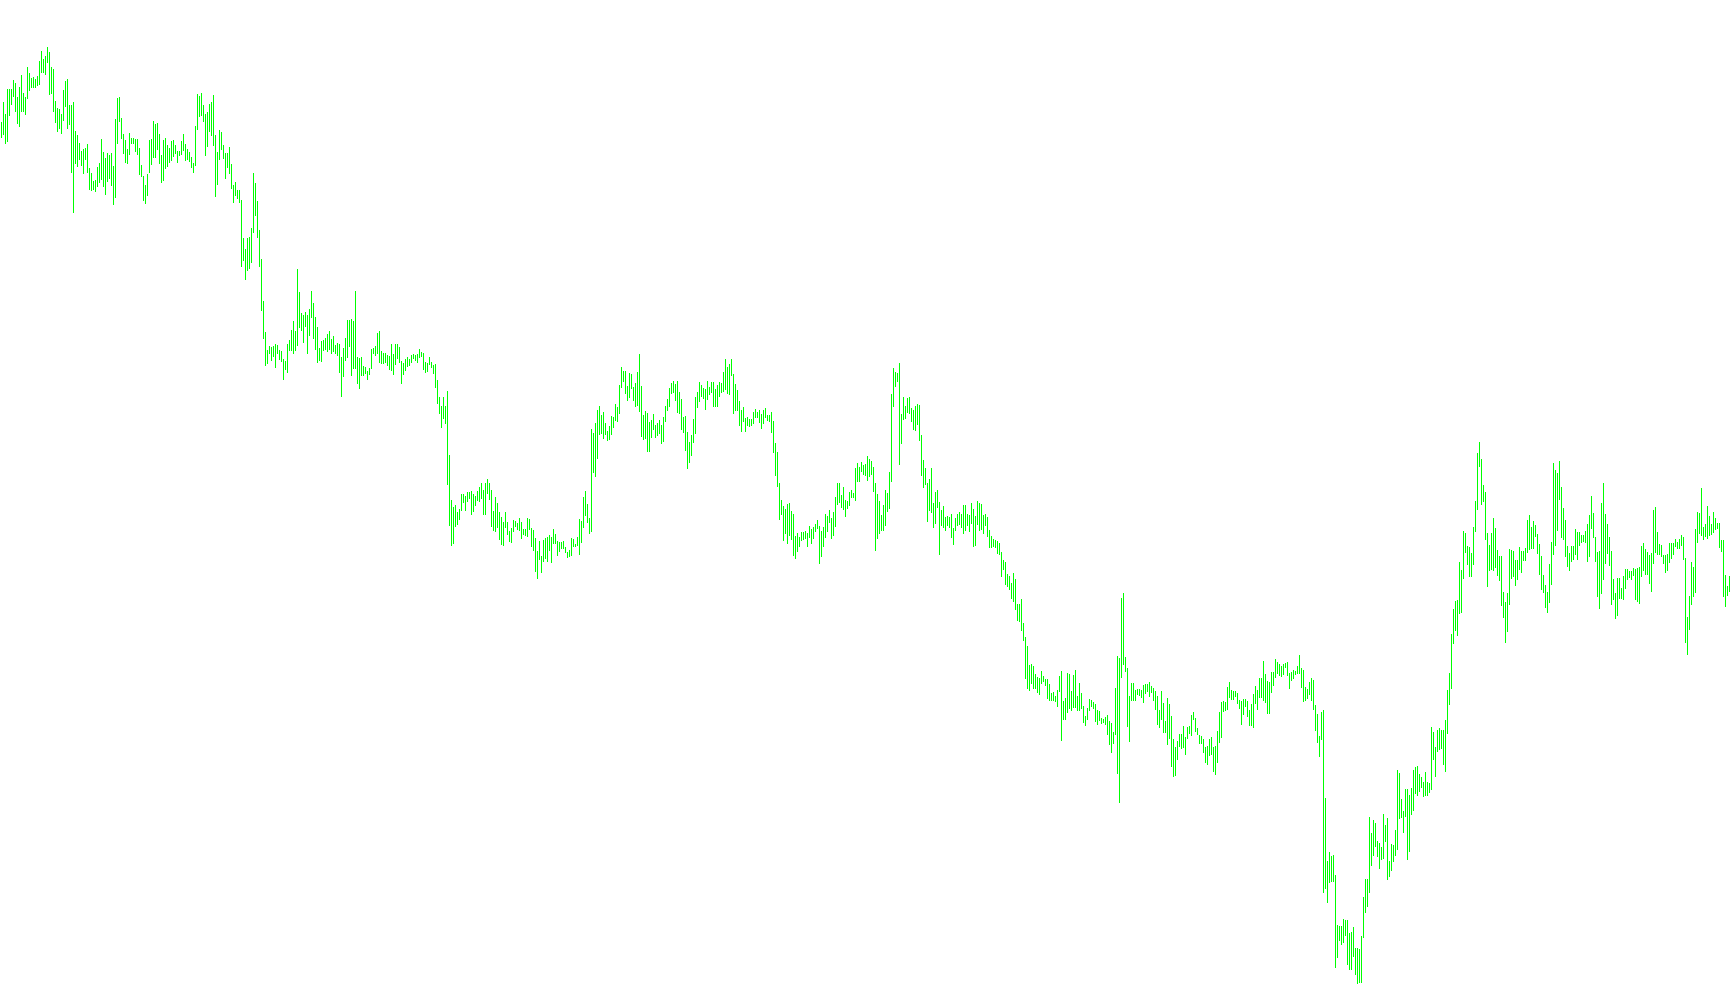
This tool is a specialized technical analysis indicator designed to help traders visualize price boundaries on a chart. It identifies and plots "Donchian Channels," which are essentially dynamic boundaries that track the highest and lowest prices reached over a specific period of time. By observing these channels, traders can better understand market volatility and identify potential breakout points or areas where the price might face resistance and support.
Core Functionality
The script works by scanning backward through historical price data to calculate the "extremes" of a chosen timeframe. Instead of just showing the current price, it draws two distinct lines that represent the upper and lower boundaries of the market's recent range.
Key Logic Components
- Time Horizon (Periods): The user can define how many previous bars (candles) the indicator should look back at to determine the current range. A larger number creates a wider, slower-moving channel, while a smaller number makes the channel more sensitive to immediate price fluctuations.
- Extreme Point Selection: The script offers three different ways to calculate where the "top" and "bottom" of the price range are located:
- Highest High/Lowest Low: This looks at the absolute peak and valley reached in the period.
- Opening Prices: This identifies the price at which the highest and lowest bars opened, focusing on the starting point of those movements.
- Median Points: This calculates a middle ground between the opening price and the highest/lowest points, providing a balanced view of where the price concentrated.
- Margin Adjustments: A unique feature of this script is the ability to "shrink" or "expand" the visual boundaries. By applying a margin percentage, the user can pull the boundary lines slightly inward or outward from the true extremes. This is often used to create a "buffer zone," ensuring that a trade is only considered valid once the price has clearly broken past a certain threshold.
- Visual Offsetting: The logic includes an "Advance" feature, which allows the user to shift the visual placement of the lines forward or backward on the chart, providing extra flexibility in how the data is displayed relative to current live candles.
Summary for the Trader
In simple terms, this script acts as a "boundary map." It tells you, "Based on the last X amount of time, this is the territory the price has occupied." By adjusting the calculation methods and margins, you can fine-tune these boundaries to suit your specific trading style—whether you prefer following tight, reactive price movements or broader, more stable market trends.
//+------------------------------------------------------------------+
//|                      Donchian Channels - Generalized version.mq4 |
//|                         Copyright © 2005, Luis Guilherme Damiani |
//|                                      http://www.damianifx.com.br |
//+------------------------------------------------------------------+
#property copyright "Copyright © 2005, Luis Guilherme Damiani"
#property link      "http://www.damianifx.com.br"

#property indicator_chart_window
#property indicator_buffers 4
#property indicator_color1 Magenta
#property indicator_color2 SteelBlue

//Periods: number of bars used for calculating the Donchian channel
//Extremes: if 1 uses the highest high and the lowest low -> I do not recomend using this
//			if 0 uses the open of the extremes bar -> the open point of a bar (as well as the close
//				are the points of maximum probability of concentration of the prices during the bar
//			if 3 uses the median point most extreme open and lowest low or highest high
//Margins: is the percent of the channel subtrated from the channel border before printing it, negative values are allowed
//Advance: the numbers of bars ahead
//---- input parameters
extern int       Periods=24;
extern int       Extremes=3;
extern int       Margins=0;
extern int       Advance=0;
extern int       max_bars=700;
//---- buffers
double ExtMapBuffer1[];
double ExtMapBuffer2[];
//+------------------------------------------------------------------+
//| Custom indicator initialization function                         |
//+------------------------------------------------------------------+
int init()
  {
//---- indicators
   SetIndexStyle(0,DRAW_LINE,1,2);
   SetIndexBuffer(0,ExtMapBuffer1);
   SetIndexStyle(1,DRAW_LINE,1,2);
   SetIndexBuffer(1,ExtMapBuffer2);

   IndicatorShortName("DoC("+Periods+")");

//----
   return(0);
  }
//+------------------------------------------------------------------+
//| Custor indicator deinitialization function                       |
//+------------------------------------------------------------------+
int deinit()
  {
//----

//----
   return(0);
  }
//+------------------------------------------------------------------+
//| Custom indicator iteration function                              |
//+------------------------------------------------------------------+
int start()
{
   int    fixed_bars=IndicatorCounted();
   //----

   //int shift=0;//, cnt(0), loopbegin(0);
   double smin=0, smax=0, SsMax=0, SsMin=0;
   //Variables : bar(0), prevbars(0), start(0), cs(0), prevcs(0),commodt(0);

   if(max_bars == 0) max_bars = Bars;

   for (int shift=0;shift< max_bars;shift++)
   {
	  if (Extremes ==1)
	  {
		 SsMax = High[Highest(NULL,0,MODE_HIGH,Periods,shift)];
		 SsMin = Low[Lowest(NULL,0,MODE_LOW,Periods,shift)];
	  }
	  else if (Extremes == 3)
	  {
		 SsMax = (Open[Highest(NULL,0,MODE_OPEN,Periods,shift)]+High[Highest(NULL,0,MODE_HIGH,Periods,shift)])/2;
		 SsMin = (Open[Lowest(NULL,0,MODE_OPEN,Periods,shift)]+Low[Lowest(NULL,0,MODE_LOW,Periods,shift)])/2;
	  }
	     else
	  {
		SsMax = Open[Highest(NULL,0,MODE_OPEN,Periods,shift)];
		SsMin = Open[Lowest(NULL,0,MODE_OPEN,Periods,shift)];
	  }
	  smin = SsMin+(SsMax-SsMin)*Margins/100;
	  smax = SsMax-(SsMax-SsMin)*Margins/100;
	  ExtMapBuffer1[shift-Advance]=smin;
	  ExtMapBuffer2[shift-Advance]=smax;
   }
//----
   return(0);
  }
//+------------------------------------------------------------------+
Comments