DDFX 5 Fast Trend v3
Download script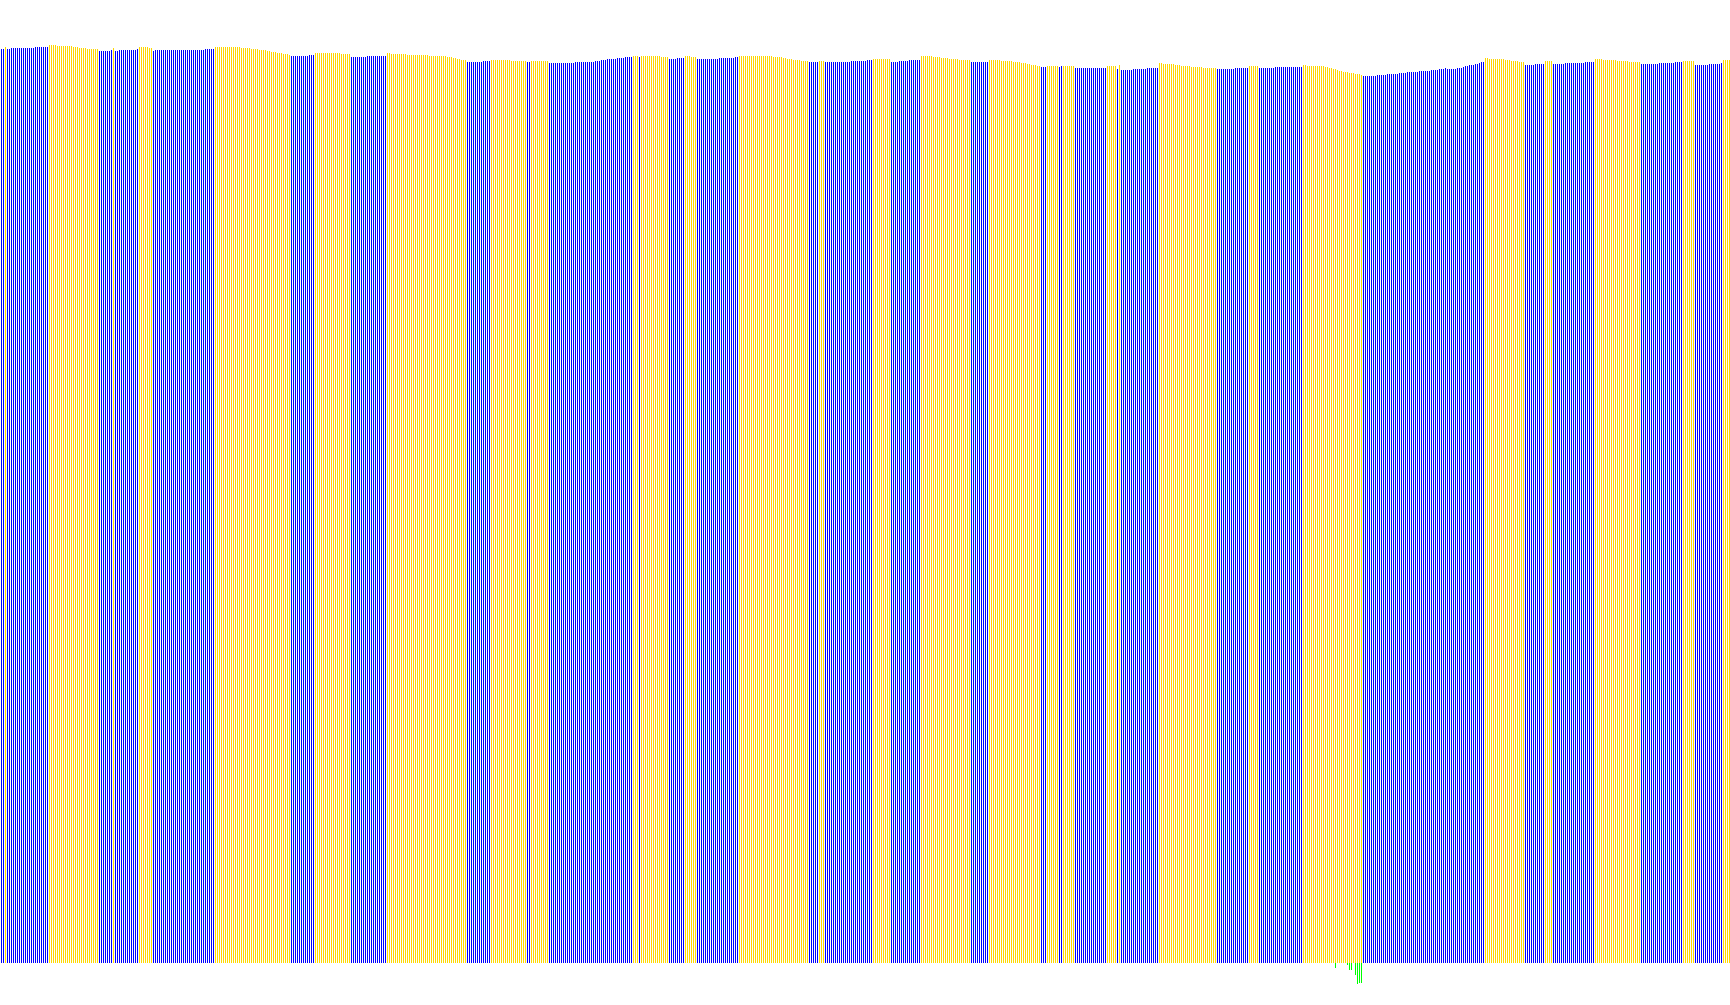
This technical indicator is designed to provide traders with a visual representation of market momentum and trend direction by utilizing a modified version of the Parabolic SAR (Stop and Reverse) logic. Instead of appearing directly on the price chart, it occupies its own dedicated window below the main chart, displaying data as a histogram for easy identification of trend shifts.
Core Logic and Functionality
The primary goal of this tool is to distinguish between upward and downward market movements by comparing the calculated Parabolic SAR value against the highest price reached during a specific time period.
The logic operates through the following steps:
- Trend Calculation: The script continuously monitors the market's volatility and price movement using two primary settings: a "Step" (which determines how quickly the indicator reacts to changes) and a "Maximum" (which sets a limit on how much the calculation can accelerate).
- Dynamic Comparison: For every historical bar on the chart, the script calculates a reference point. It then performs a real-time comparison between this reference point and the high price of that specific bar.
- Trend Identification:
- Upward Trend (Red Histogram): If the calculated reference point is equal to or higher than the bar's high price, the script identifies this as an "Up Channel." It marks this on the indicator window with a red histogram.
- Downward Trend (Blue Histogram): If the calculated reference point falls below the bar's high price, the script interprets this as a "Down Channel." It marks this movement with a blue histogram.
Visual Output
The indicator simplifies complex market data into a clear, two-color visual guide:
- SAR Up Channel (Red): Represents periods where the trend logic suggests an upward bias.
- SAR Down Channel (Blue): Represents periods where the trend logic suggests a downward bias.
By using this histogram approach, the tool allows users to quickly see which "channel" the market is currently favoring without cluttering the primary price action area of the trading platform.
/*
   Generated by EX4-TO-MQ4 decompiler V4.0.224.1 []
   Website: http://purebeam.biz
   E-mail : purebeam@gmail.com
*/
#property copyright "Kalenzo Code"

#property indicator_separate_window
#property indicator_minimum 0.0
#property indicator_maximum 1.0
#property indicator_buffers 2
#property indicator_color1 Red
#property indicator_color2 Blue

double g_ibuf_76[];
double g_ibuf_80[];
extern double Step = 0.013;
extern double Maximum = 0.2;
extern int Precision = 5;

int init() {
   SetIndexStyle(0, DRAW_HISTOGRAM);
   SetIndexStyle(1, DRAW_HISTOGRAM);
   SetIndexBuffer(0, g_ibuf_76);
   SetIndexBuffer(1, g_ibuf_80);
   IndicatorShortName("FAST TREND");
   SetIndexLabel(0, "SAR Up Channel");
   SetIndexLabel(1, "SAR Down Channel");
   SetIndexDrawBegin(0, 2);
   SetIndexDrawBegin(1, 2);
   return (0);
}

int deinit() {
   return (0);
}

int start() {
   double ld_12;
   int li_4 = IndicatorCounted();
   if (li_4 < 0) li_4 = 0;
   if (li_4 > 0) li_4--;
   int li_0 = Bars - li_4;
   for (int li_8 = 0; li_8 < li_0; li_8++) {
      ld_12 = NormalizeDouble(iSAR(Symbol(), 0, Step, Maximum, li_8), Precision);
      if (ld_12 >= iHigh(Symbol(), 0, li_8)) {
         g_ibuf_76[li_8] = ld_12;
         g_ibuf_80[li_8] = 0;
      } else {
         g_ibuf_76[li_8] = 0;
         g_ibuf_80[li_8] = ld_12;
      }
   }
   return (0);
}
Comments