Delta
Download script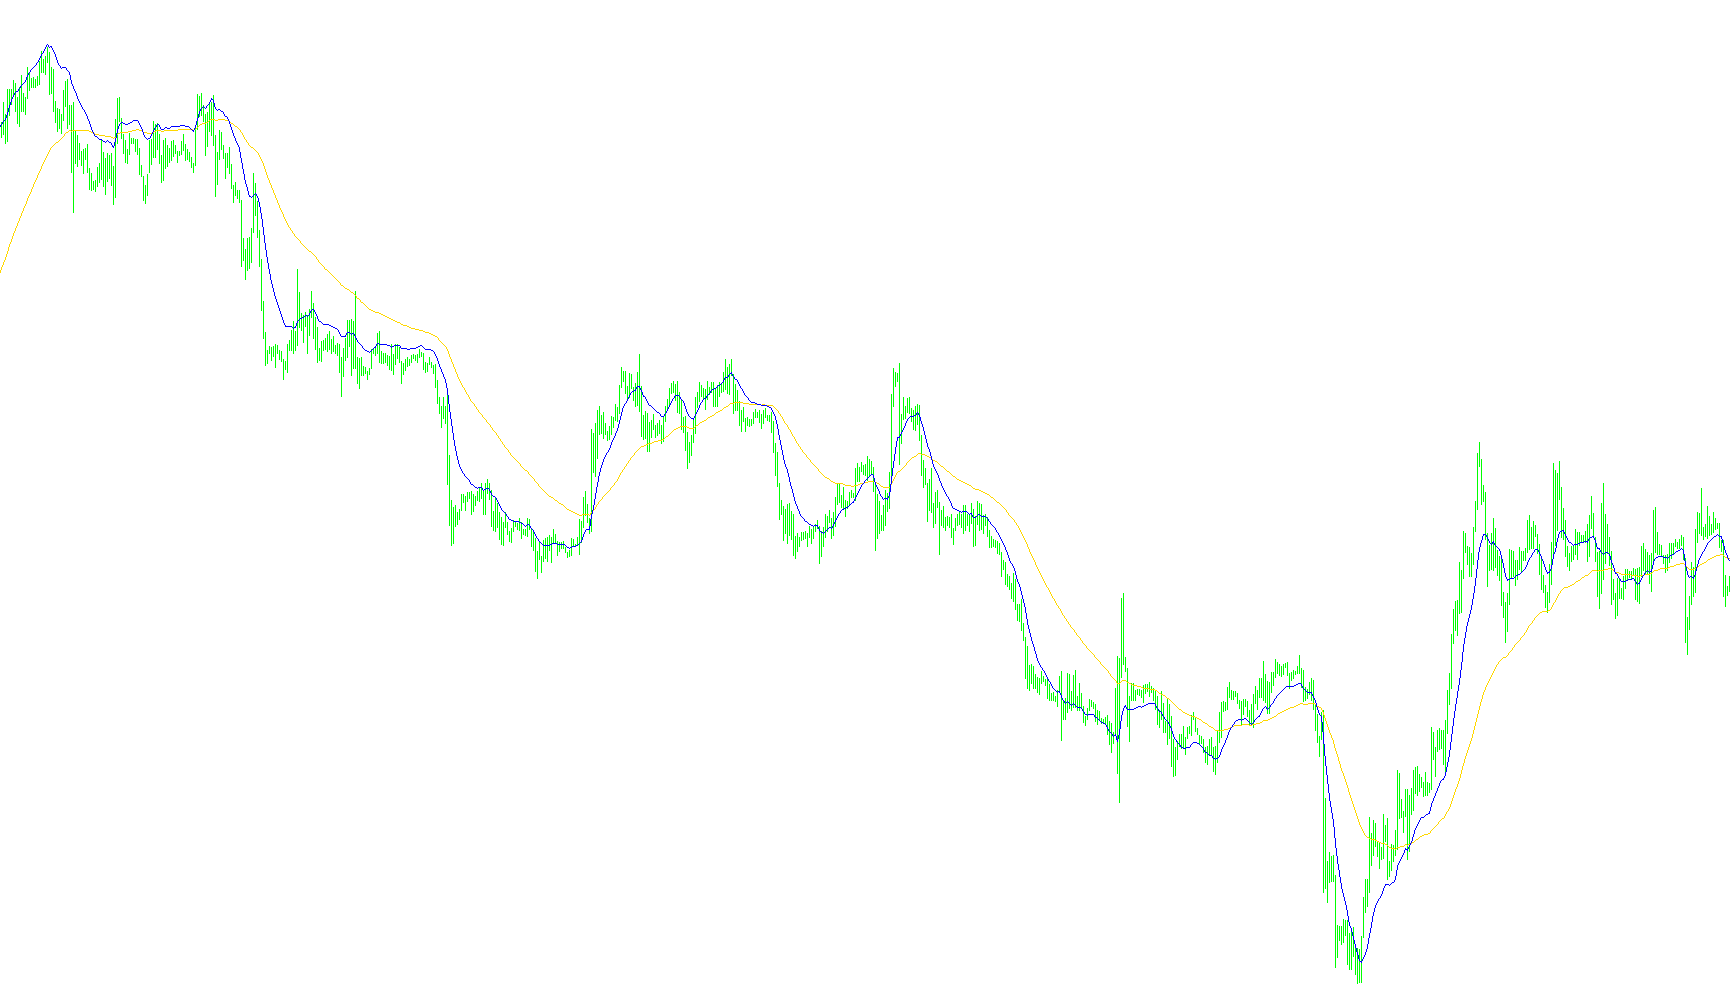
This tool is designed to help traders visualize the relationship between current market prices and specific moving averages. Instead of showing you the price action itself, this indicator translates price movements into a "distance" metric, allowing you to see how far away the market is from two different trend indicators at any given moment.
How it Works
The logic operates by calculating two distinct types of moving averages simultaneously:
- A Slow Trend Line: Based on a longer period (defaulting to 60), which represents the broader market direction.
- A Fast Trend Line: Based on a shorter period (defaulting to 13), which captures more immediate price momentum.
The Visual Logic
The script takes the current closing price of the asset and calculates the mathematical gap between that price and both moving averages. It then plots these gaps as two separate lines in a dedicated window below your main chart:
- Distance Tracking: Rather than showing the "value" of the average, it shows the "difference." For example, if the price is moving closer to the trend line, the line on the indicator will move toward zero. If the price is pulling away, the line moves further out.
- Dynamic Scaling: The tool handles various market conditions by ensuring that even when the price touches a moving average perfectly (a zero difference), it maintains a visible presence on your screen so you can track the movement continuously.
- Customizable Scope: You have the option to view this data across the entire history of the chart or limit the calculation to a specific number of recent bars, depending on your preference for historical analysis.
Practical Use for Traders
By observing these two lines together in the indicator window, you can identify "overextended" market conditions. When the distance between the price and the moving averages becomes significantly large, it may suggest that the market is stretched. Conversely, as the lines converge toward zero, it indicates the price is reacting closely to the trend. This allows you to monitor momentum and potential exhaustion visually without cluttering your primary price chart.
//+------------------------------------------------------------------+
//|                                                        SmWPR.mq4 |
//|                      Copyright © 2006, MetaQuotes Software Corp. |
//|                                        http://www.metaquotes.net |
//+------------------------------------------------------------------+
#property copyright "Copyright © 2006, MetaQuotes Software Corp."
#property link      "http://www.metaquotes.net"

#property indicator_separate_window
#property indicator_buffers 2
#property indicator_color1 Blue
#property indicator_color2 Red
//---- input parameters

extern int       sper=60;
extern int       fper=13;
extern int       test=0;
extern int       nBars=100;
//---- buffers
double ExtMapBuffer1[];
double ExtMapBuffer2[];
double shift, sdel, fdel, mas, maf, mBar;
//+------------------------------------------------------------------+
//| Custom indicator initialization function                         |
//+------------------------------------------------------------------+
int init()
  {
//---- indicators
   SetIndexStyle(0,DRAW_LINE);
   SetIndexBuffer(0,ExtMapBuffer1);
   SetIndexStyle(1,DRAW_LINE);
   SetIndexBuffer(1,ExtMapBuffer2);
//----
   return(0);
  }
//+------------------------------------------------------------------+
//| Custom indicator iteration function                              |
//+------------------------------------------------------------------+
int start()
  {

      for(int shift=Bars-1; shift>0; shift--)
      {
         ExtMapBuffer1[shift]=0;
         ExtMapBuffer2[shift]=0;
      }

      if (test==1) {mBar=nBars;} else {mBar=Bars;}

      for(shift=Bars-1; shift>0; shift--)
      {
         mas=iMA(NULL, 0, sper, 0, MODE_EMA, PRICE_CLOSE,shift-1);
         maf=iMA(NULL, 0, fper, 0, MODE_EMA, PRICE_CLOSE,shift-1);
         sdel=MathRound((mas-Close[0])/Point);
         fdel=MathRound((maf-Close[0])/Point);
         if (sdel==0) {sdel=0.0001;}
         if (fdel==0) {fdel=0.0001;}
         if (sdel!=0) {ExtMapBuffer1[shift-1]=sdel;}
         if (fdel!=0) {ExtMapBuffer2[shift-1]=fdel;}
      }

   return(0);
  }
//+------------------------------------------------------------------+
Comments