dex_SolarWind
Download script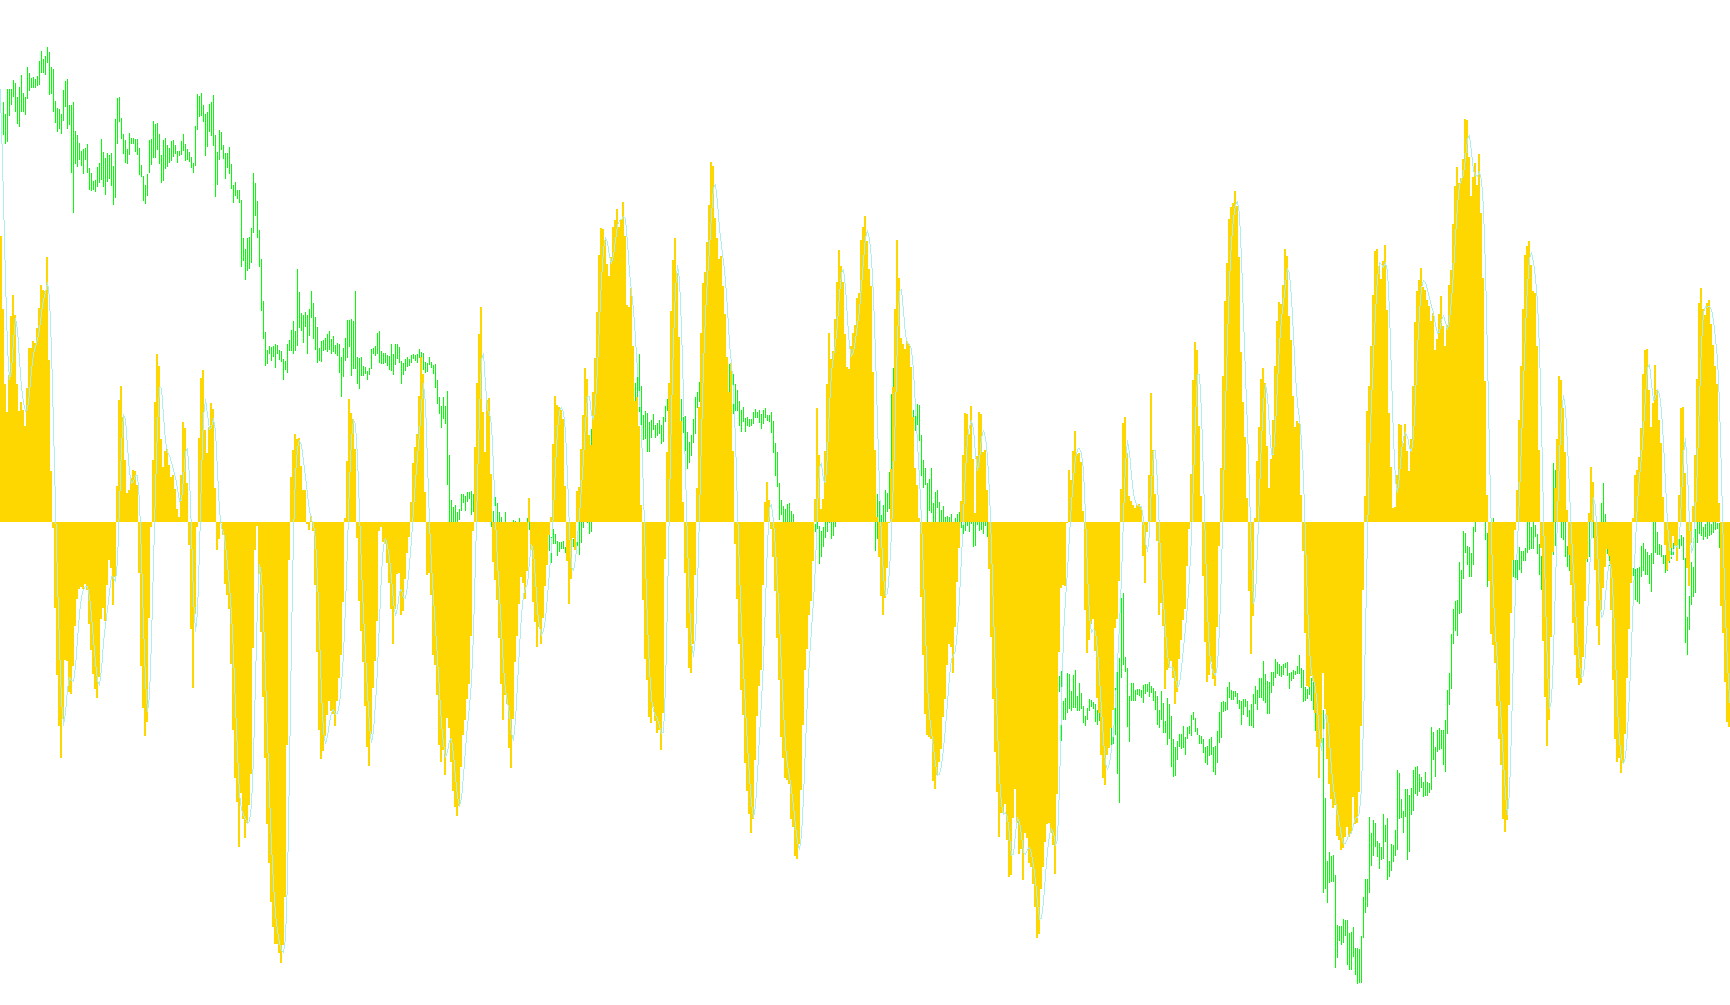
This technical indicator, titled dex_SolarWind, is designed to provide traders with a visual representation of market momentum and price trends by analyzing the relationship between current price action and historical extremes. Instead of simply showing where the price is, it attempts to calculate the "velocity" and "smoothness" of the trend to help identify directional shifts.
Core Logic and Methodology
The script operates through a multi-layered calculation process that transforms raw price data into a smoothed visual trend:
1. Price Point Identification The logic begins by selecting a specific reference point for each candle. Depending on the user's settings, the tool can look at the opening price, closing price, highs, lows, or various weighted averages (such as the midpoint of the high/low range). This allows the indicator to be customized based on how "aggressive" or "conservative" a trader wants the data source to be.
2. Range Analysis (Highs and Lows) The script scans a specific number of previous candles (the "period") to identify the highest peak and the lowest valley reached during that timeframe. By establishing these boundaries, the indicator creates a dynamic range. It then calculates where the current price sits within that high-to-low range—essentially determining if the price is leaning toward the ceiling, the floor, or hovering in the middle.
3. Momentum Smoothing To prevent the data from being too "jittery" (reacting too violently to every tiny price flicker), the script employs a weighting system. It takes the current relative position of the price and blends it with the previous calculated values. This creates a cumulative momentum flow, ensuring that the resulting visual line reflects a sustained trend rather than momentary noise.
4. Logarithmic Scaling and Multi-Layer Smoothing The final step involves a mathematical transformation where the raw momentum is converted into a logarithmic scale. This helps in visualizing trends more clearly when price movements are large. Finally, the script passes this data through two consecutive smoothing layers (Moving Averages).
Visual Output
The result of these calculations is displayed in a separate window on your chart:
- Primary Trend: A main visual representation of the smoothed momentum.
- Exit/Signal Line: A secondary, even smoother line that tracks the primary trend's movement.
By observing the relationship between these lines and the underlying momentum, users can identify when a trend is gaining strength, losing steam, or potentially reversing.
//+------------------------------------------------------------------+
//|                                                dex_SolarWind.mq4 |
//|                                        Copyright © 2006, akadex. |
//|                                                           tohell |
//+------------------------------------------------------------------+
#property copyright "Copyright © 2006, akadex"
#property link      "tohell"
#property indicator_separate_window
#property indicator_buffers 3
#property indicator_color1 Gray
#property indicator_color2 Aqua
#property indicator_color3 Red
#property indicator_level1 0

extern int period=12;
extern int price=6;
extern int smoothperiod=3;
extern int TypeMA=3;

double buffer[],MA1buffer[],MA2buffer[],Value[],Fish[];
double MaxH,MinL,Price;
int i;
//+------------------------------------------------------------------+
//| Custom indicator initialization function                         |
//+------------------------------------------------------------------+
int init()
{
   IndicatorBuffers(4);
  SetIndexStyle(0,DRAW_HISTOGRAM,0,2);
  SetIndexLabel(0,"Trend");
  SetIndexBuffer(0,buffer);
  SetIndexStyle(1,DRAW_NONE);
  SetIndexBuffer(1,MA1buffer);
  SetIndexStyle(2,DRAW_LINE,0,1);
  SetIndexLabel(2,"Exit "+smoothperiod);
  SetIndexBuffer(2,MA2buffer);
  SetIndexBuffer(3,Value);


   string short_name="dex_SolarWind";
   IndicatorShortName(short_name);
   return(0);
}
int deinit()
{
   return(0);
}

int start()
{
	int    limit;
	int    counted_bars = IndicatorCounted();
	if (counted_bars>0)
		counted_bars--;
	else
	counted_bars = 1;
	limit = Bars - counted_bars;

	for (i=limit; i>=0; i--)
	{
   switch (price)
     {
     case 1: Price = Open[i]; break;
     case 2: Price = Close[i]; break;
     case 3: Price = High[i]; break;
     case 4: Price = Low[i]; break;
     case 5: Price = (High[i]+Low[i]+Close[i])/3; break;
     case 6: Price = (Open[i]+High[i]+Low[i]+Close[i])/4; break;
     case 7: Price = (Open[i]+Close[i])/2; break;
    default: Price = (High[i]+Low[i])/2; break;
     }
   // Îïðåäåëÿåì ìèíèìóì è ìàêñèìóì çà èññëåäóåìûé ïåðèîä
   MaxH = High[Highest(NULL,0,MODE_HIGH,period,i)];
   MinL = Low[Lowest(NULL,0,MODE_LOW,period,i)];

   // Âû÷èñëÿåì çíà÷åíèÿ
   Value[i] = 0.33*2*((Price-MinL)/(MaxH-MinL)-0.5) + 0.67*Value[i+1];
   buffer[i] = 0.5*MathLog((1+Value[i])/(1-Value[i]))+0.5*Fish[i+1];
   }
	for (i=limit; i>=0; i--)
	{
   MA1buffer[i]=iMAOnArray(buffer,0,smoothperiod,0,TypeMA,i);
	}
	for (i=limit; i>=0; i--)
	{
   MA2buffer[i]=iMAOnArray(MA1buffer,0,smoothperiod,0,TypeMA,i);
	}
   return(0);
}
Comments