DigFiltr[1]
Download script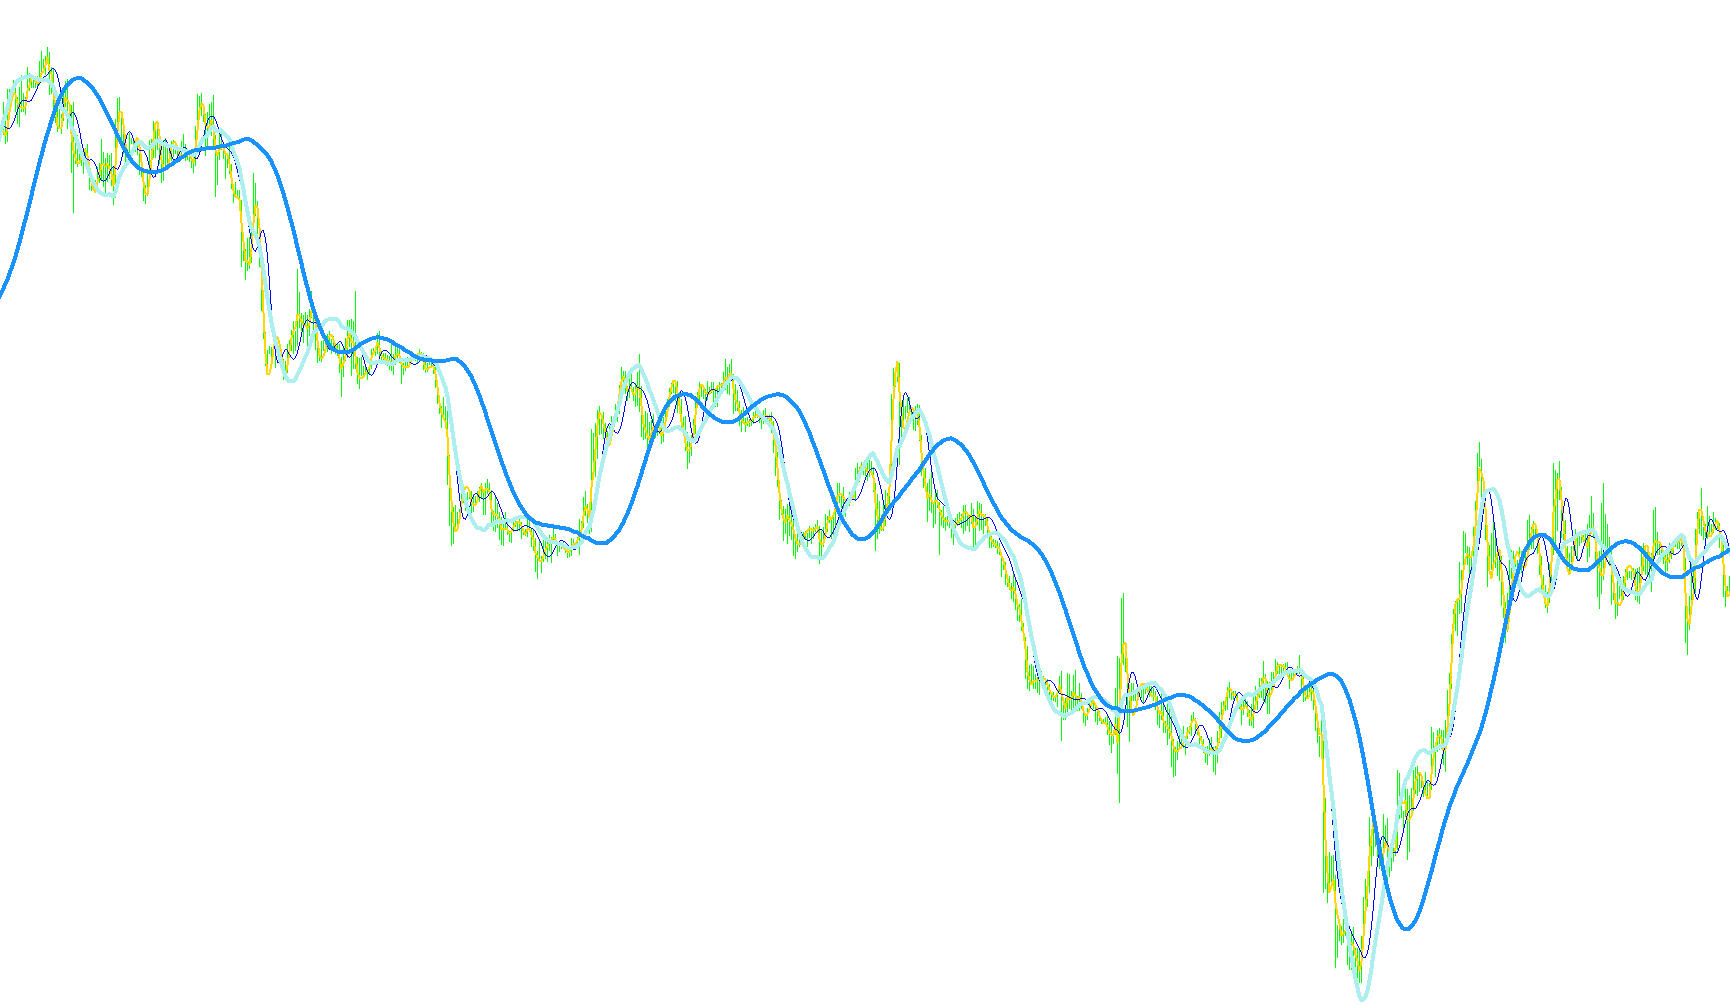
Overview of Indicator Logic
This script is a sophisticated technical analysis tool designed to analyze price action by calculating four distinct weighted moving averages simultaneously. Rather than using simple averages (where every day's price carries the same weight), this tool applies specific mathematical "weights" to different timeframes to identify trends, momentum, and potential shifts in market direction.
Core Components
1. Multi-Layered Weighted Calculations The script manages four unique data streams, each looking back at a different number of historical data points:
- FATL: A short-term focus (39 periods).
- RFTL: A slightly longer-term focus (44 periods).
- SATL: A medium-term focus (65 periods).
- RSTL: A long-term focus (91 periods).
Each of these streams uses a pre-defined coefficient (a specific multiplier) assigned to each historical price point. This means the tool gives more importance to certain past prices than others, allowing it to react more precisely to market "moods" than a standard moving average would.
2. Trend Comparison Logic The indicator doesn't just show lines; it performs a comparative analysis between these different timeframes to determine momentum. It focuses on three primary relationships:
- Short-term vs. Medium-term (FARF): Compares the 39-period data against the 44-period data.
- Short-term vs. Long-term (FASA): Compares the 39-period data against the 65-period data.
- Medium-term vs. Long-term (SARS): Compares the 65-period data against the 91-period data.
How it Determines Movement
The logic follows a "Current vs. Previous" comparison method to identify direction:
- Calculation: For every new price tick, the script calculates the gap between two different weighted averages (for example, the difference between the Short-term and the Medium-term).
- Comparison: It then looks at what that gap was on the previous candle.
- Directional Labeling:
- If the gap between the two averages is widening (increasing), the script identifies this as an "UP" trend for that specific relationship.
- If the gap is narrowing or shrinking, it identifies it as a "DOWN" trend.
Summary for the User
Essentially, this tool acts as a multi-lens microscope for market trends. By comparing how much faster a short-term trend is moving relative to a long-term trend, it helps traders visualize whether the current momentum is accelerating or decelerating across different time horizons simultaneously.
//+------------------------------------------------------------------+
//|                                                         FATL.mq4 |
//|                      Copyright © 2004, MetaQuotes Software Corp. |
//|                                        http://www.metaquotes.net |
//+------------------------------------------------------------------+
#property copyright "Copyright © 2004, MetaQuotes Software Corp."
#property link      "http://www.metaquotes.net"

#property indicator_chart_window
#property indicator_buffers 4
#property indicator_color1 Violet
#property indicator_color2 Aquamarine
#property indicator_color3 Yellow
#property indicator_color4 Red
//---- buffers
double FATLBuffer[];
double RFTLBuffer[];
double SATLBuffer[];
double RSTLBuffer[];
//+------------------------------------------------------------------+
//| FATL weights                                                     |
//+------------------------------------------------------------------+
#define FATLPeriods 39
#define RFTLPeriods 44
#define SATLPeriods 65
#define RSTLPeriods 91

double g_FATLKoef[FATLPeriods]=
  { 0.4360409450,    0.3658689069,    0.2460452079,    0.1104506886,   -0.0054034585,
   -0.0760367731,   -0.0933058722,   -0.0670110374,   -0.0190795053,    0.0259609206,
    0.0502044896,    0.0477818607,    0.0249252327,   -0.0047706151,   -0.0272432537,
   -0.0338917071,   -0.0244141482,   -0.0055774838,    0.0128149838,    0.0226522218,
    0.0208778257,    0.0100299086,   -0.0036771622,   -0.0136744850,   -0.0160483392,
   -0.0108597376,   -0.0016060704,    0.0069480557,    0.0110573605,    0.0095711419,
    0.0040444064,   -0.0023824623,   -0.0067093714,   -0.0072003400,   -0.0047717710,
    0.0005541115,    0.0007860160,    0.0130129076,    0.0040364019  };

double g_RFTLKoef[RFTLPeriods]=
 {-0.0025097319, +0.0513007762 , +0.1142800493 , +0.1699342860 , +0.2025269304 ,
  +0.2025269304, +0.1699342860 , +0.1142800493 , +0.0513007762 , -0.0025097319 ,
  -0.0353166244, -0.0433375629 , -0.0311244617 , -0.0088618137 , +0.0120580088 ,
  +0.0233183633, +0.0221931304 , +0.0115769653 , -0.0022157966 , -0.0126536111 ,
  -0.0157416029, -0.0113395830 , -0.0025905610 , +0.0059521459 , +0.0105212252 ,
  +0.0096970755, +0.0046585685 , -0.0017079230 , -0.0063513565 , -0.0074539350 ,
  -0.0050439973, -0.0007459678 , +0.0032271474 , +0.0051357867 , +0.0044454862 ,
  +0.0018784961, -0.0011065767 , -0.0031162862 , -0.0033443253 , -0.0022163335 ,
  +0.0002573669, +0.0003650790 , +0.0060440751 , +0.0018747783 };

double g_SATLKoef[SATLPeriods]=
 {0.0982862174 ,+0.0975682269 ,+0.0961401078 ,+0.0940230544 ,+0.0912437090 ,+0.0878391006 ,
 +0.0838544303 ,+0.0793406350 ,+0.0743569346 ,+0.0689666682 ,+0.0632381578 ,+0.0572428925 ,
 +0.0510534242 ,+0.0447468229 ,+0.0383959950 ,+0.0320735368 ,+0.0258537721 ,+0.0198005183 ,
 +0.0139807863 ,+0.0084512448 ,+0.0032639979 ,-0.0015350359 ,-0.0059060082 ,-0.0098190256 ,
 -0.0132507215 ,-0.0161875265 ,-0.0186164872 ,-0.0205446727 ,-0.0219739146 ,-0.0229204861 ,
 -0.0234080863 ,-0.0234566315 ,-0.0231017777 ,-0.0223796900 ,-0.0213300463 ,-0.0199924534 ,
 -0.0184126992 ,-0.0166377699 ,-0.0147139428 ,-0.0126796776 ,-0.0105938331 ,-0.0084736770 ,
 -0.0063841850 ,-0.0043466731 ,-0.0023956944 ,-0.0005535180 ,+0.0011421469 ,+0.0026845693 ,
 +0.0040471369 ,+0.0052380201 ,+0.0062194591 ,+0.0070340085 ,+0.0076266453 ,+0.0080376628 ,
 +0.0083037666 ,+0.0083694798 ,+0.0082901022 ,+0.0080741359 ,+0.0077543820 ,+0.0073260526 ,
 +0.0068163569 ,+0.0062325477 ,+0.0056078229 ,+0.0049516078,+0.0161380976 };


double g_RSTLKoef[RSTLPeriods]=
 {-0.0074151919,-0.0060698985,-0.0044979052,-0.0027054278,-0.0007031702,+0.0014951741,
  +0.0038713513,+0.0064043271,+0.0090702334,+0.0118431116,+0.0146922652,+0.0175884606,
  +0.0204976517,+0.0233865835,+0.0262218588,+0.0289681736,+0.0315922931,+0.0340614696,
  +0.0363444061,+0.0384120882,+0.0402373884,+0.0417969735,+0.0430701377,+0.0440399188,
  +0.0446941124,+0.0450230100,+0.0450230100,+0.0446941124,+0.0440399188,+0.0430701377,
  +0.0417969735,+0.0402373884,+0.0384120882,+0.0363444061,+0.0340614696,+0.0315922931,
  +0.0289681736,+0.0262218588,+0.0233865835,+0.0204976517,+0.0175884606,+0.0146922652,
  +0.0118431116,+0.0090702334,+0.0064043271,+0.0038713513,+0.0014951741,-0.0007031702,
  -0.0027054278,-0.0044979052,-0.0060698985,-0.0074151919,-0.0085278517,-0.0094111161,
  -0.0100658241,-0.0104994302,-0.0107227904,-0.0107450280,-0.0105824763,-0.0102517019,
  -0.0097708805,-0.0091581551,-0.0084345004,-0.0076214397,-0.0067401718,-0.0058083144,
  -0.0048528295,-0.0038816271,-0.0029244713,-0.0019911267,-0.0010974211,-0.0002535559,
  +0.0005231953,+0.0012297491,+0.0018539149,+0.0023994354,+0.0028490136,+0.0032221429,
  +0.0034936183,+0.0036818974,+0.0038037944,+0.0038338964,+0.0037975350,+0.0036986051,
  +0.0035521320,+0.0033559226,+0.0031224409,+0.0028550092,+0.0025688349,+0.0022682355,
  +0.0073925495 };


//+------------------------------------------------------------------+
//| Custom indicator initialization function                         |
//+------------------------------------------------------------------+
int init()
  {
//---- indicators
   IndicatorBuffers(4);
   SetIndexStyle(0,DRAW_LINE,STYLE_SOLID,2);
   SetIndexBuffer(0, FATLBuffer);
   SetIndexDrawBegin(0,39);

   SetIndexStyle(1,DRAW_LINE,STYLE_SOLID,1);
   SetIndexBuffer(1, RFTLBuffer);
   SetIndexDrawBegin(1,44);

   SetIndexStyle(2,DRAW_LINE,STYLE_SOLID,4);
   SetIndexBuffer(2, SATLBuffer);
   SetIndexDrawBegin(2,65);

   SetIndexStyle(3,DRAW_LINE,STYLE_SOLID,4);
   SetIndexBuffer(3, RSTLBuffer);
   SetIndexDrawBegin(3,91);
//----
   return(0);
  }
//+------------------------------------------------------------------+
//| Custor indicator deinitialization function                       |
//+------------------------------------------------------------------+
int deinit()
  {
//---- TODO: add your code here

//----
   return(0);
  }
//+------------------------------------------------------------------+
//| Custom indicator iteration function                              |
//+------------------------------------------------------------------+
int start()
{
   int    counted_bars=IndicatorCounted();
//---- TODO: add your code here

   int    j,pos;
   double sum1,sum2,sum3,sum4;
//----
   if(counted_bars<0)  return(-1);
   //if (counted_bars>0) counted_bars--;


//---- main calculation loop
   for (pos=Bars-counted_bars-1;pos>=0;pos--)
     {

      sum1=0;          // zero summary
      for(j=0;j<FATLPeriods;j++) sum1+=g_FATLKoef[j]*Close[pos+j];//Counted FATL[pos]
	   FATLBuffer[pos]=sum1;

	   sum2=0;          // zero summary
      for(j=0;j<RFTLPeriods;j++) sum2+=g_RFTLKoef[j]*Close[pos+j];//Counted RFTL[pos]
	   RFTLBuffer[pos]=sum2;

	   sum3=0;          // zero summary
      for(j=0;j<SATLPeriods;j++) sum3+=g_SATLKoef[j]*Close[pos+j];//Counted SATL[POS]
	   SATLBuffer[pos]=sum3;

	   sum4=0;          // zero summary
      for(j=0;j<RSTLPeriods;j++) sum4+=g_RSTLKoef[j]*Close[pos+j];//Counted RSTL[pos]
	   RSTLBuffer[pos]=sum4;

	   int FARF=MathRound((sum1-sum2)/Point);
	   int FARFPrev=MathRound((FATLBuffer[pos+1]-RFTLBuffer[pos+1])/Point);
	   if (FARF>FARFPrev) string FAR="UP"; else FAR="DOWN";

	   int FASA=MathRound((sum1-sum3)/Point);
	   int FASAPrev=MathRound((FATLBuffer[pos+1]-SATLBuffer[pos+1])/Point);
	   if (FASA>FASAPrev) string FAS="UP"; else FAS="DOWN";

	   int SARS=MathRound((sum3-sum4)/Point);
	   int SARSPrev=MathRound((SATLBuffer[pos+1]-RSTLBuffer[pos+1])/Point);
	   if (SARS>SARSPrev) string SAS="UP"; else SAS="DOWN";


     }
   /*Comment("   FARF = ",FARF ,"         ", FAR, "\n",
           "   FASA = ",FASA ,"         ", FAS, "\n",
           "   SARS = ",SARS ,"         ", SAS, "\n",
           "   RSTL= ",sum4 );*/
   return(0);
}
//+------------------------------------------------------------------+
Comments