Disparity Index
Download script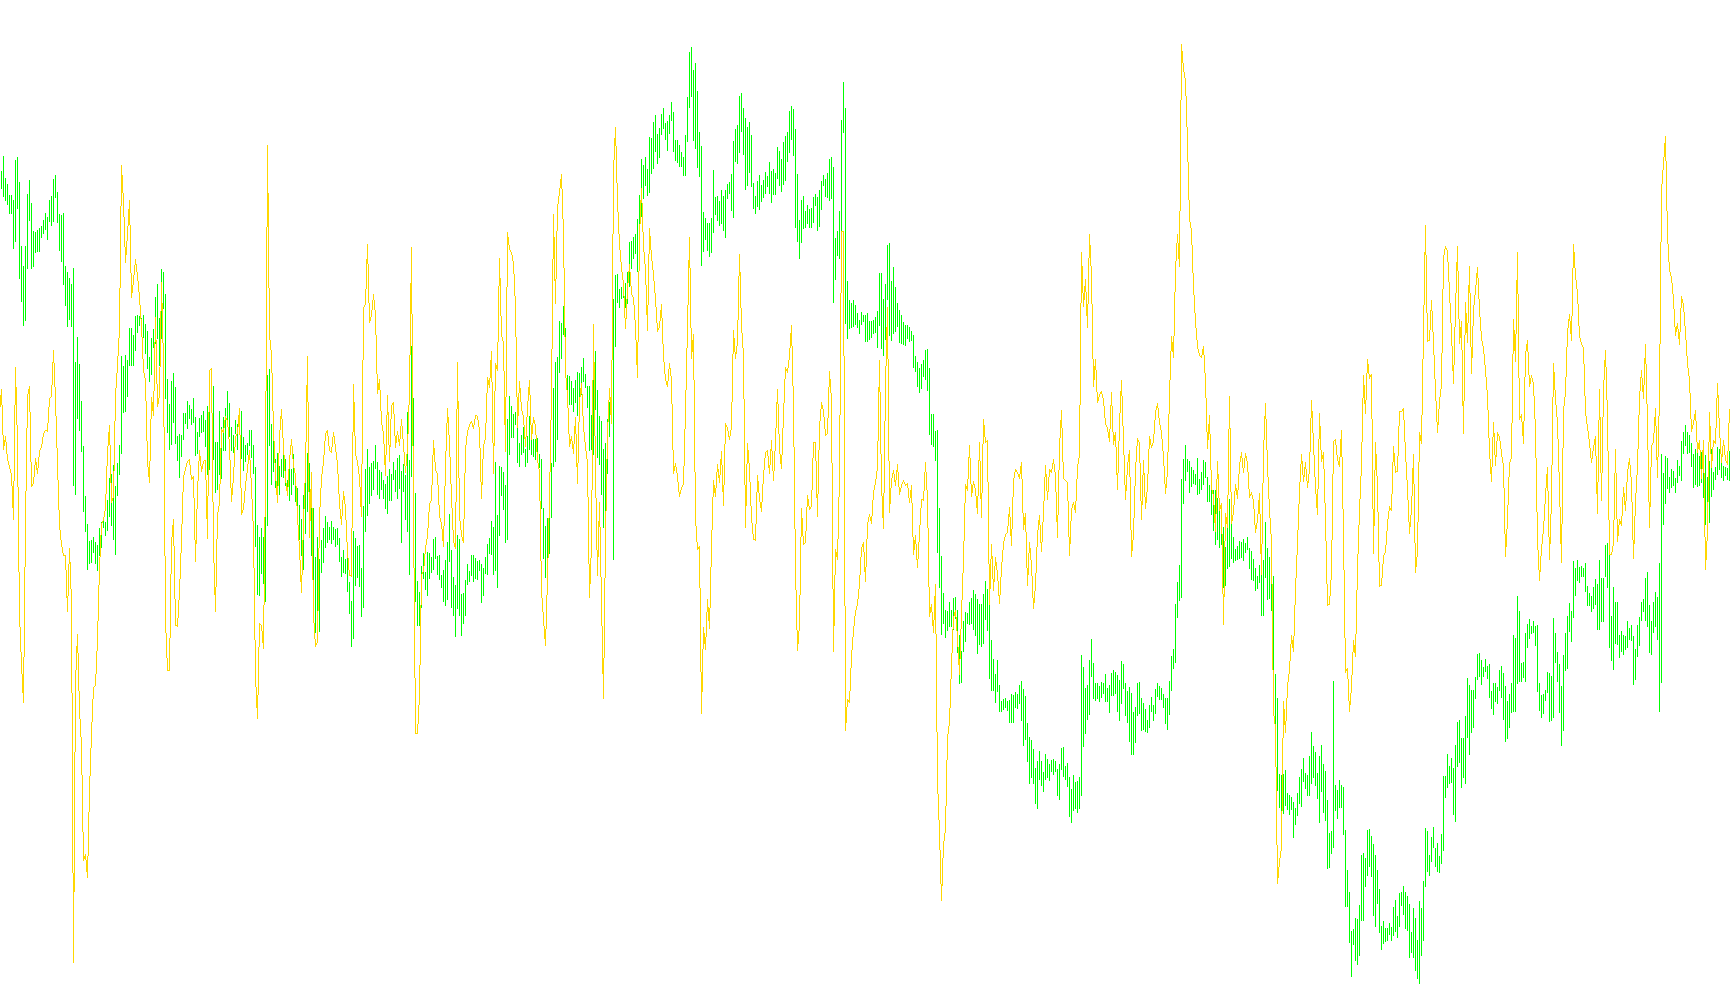
The Disparity Index is a visual financial tool designed to help traders identify the relationship between the current market price and its historical average. By measuring this gap, it provides a clear picture of whether an asset is overextended, undervalued, or currently trending strongly in a specific direction.
How It Works
The logic behind this indicator centers on calculating the "distance" between the real-time closing price and a smoothed moving average. Instead of just looking at the price alone, the tool compares it against a baseline—specifically an Exponential Moving Average (EMA).
The process follows three main steps:
- Baseline Establishment: The script calculates a moving average over a specific number of previous periods (defaulting to 13). This represents the "fair value" or the recent trend of the asset.
- Variance Calculation: It determines the difference between the current price and that moving average.
- Percentage Conversion: Finally, it converts that difference into a percentage. This allows the indicator to show how much the price has deviated from its average relative to its own value.
What It Tells You
The result is plotted as a separate line in a dedicated window below your main price chart.
- Above Zero: When the line sits above the zero mark, it indicates that the current market price is trading higher than its recent average. A rising line suggests accelerating upward momentum.
- Below Zero: When the line drops below zero, it signifies that the price is trading lower than its average, indicating downward pressure.
- Volatility Tracking: Because the tool uses a percentage of the moving average, it scales the data to ensure that the "gap" is meaningful regardless of whether the asset's price is very high or relatively low.
In essence, this tool acts as a momentum gauge, helping you visualize how far the market has "stretched" away from its mean, which can be a key signal for identifying potential trend strength or exhaustion points.
//+------------------------------------------------------------------+
//|                                              Disparity Index.mq4 |
//|                                                         Linuxser |
//|                                          contact me in Forex TSD |
//+------------------------------------------------------------------+
#property copyright ""
#property link      ""
//----
#property indicator_separate_window
#property indicator_buffers 1
#property indicator_color1 Red
//---- input parameters
extern int DispPeriod = 13;
//---- buffers
double DispBuffer[];
//+------------------------------------------------------------------+
//| Custom indicator initialization function                         |
//+------------------------------------------------------------------+
int init()
  {
   string short_name;
//---- indicator line
   SetIndexStyle(0, DRAW_LINE);
   SetIndexBuffer(0, DispBuffer);
//---- name for DataWindow and indicator subwindow label
   short_name = "Disparity Index(" + DispPeriod + ")";
   IndicatorShortName(short_name);
   SetIndexLabel(0, short_name);
//----
   SetIndexDrawBegin(0, DispPeriod);
//----
   return(0);
  }
//+------------------------------------------------------------------+
//| Momentum                                                         |
//+------------------------------------------------------------------+
int start()
  {
   int i, counted_bars = IndicatorCounted();
//----
   if(Bars <= DispPeriod)
       return(0);
//---- initial zero
   if(counted_bars < 1)
       for(i = 1; i <= DispPeriod; i++)
           DispBuffer[Bars-i] = 0.0;
//----
   i = Bars - DispPeriod - 1;
   if(counted_bars >= DispPeriod)
       i = Bars - counted_bars - 1;
   while(i >= 0)
     {
       DispBuffer[i] = ((Close[i] - iMA(NULL, 0, DispPeriod, 0,
                        MODE_EMA, PRICE_CLOSE, i)) /
                        (iMA(NULL, 0, DispPeriod, 0, MODE_EMA,
                        PRICE_CLOSE, i))*100);
       i--;
     }
   return(0);
  }
//+------------------------------------------------------------------+
Comments