Distributive_Pricing
Download script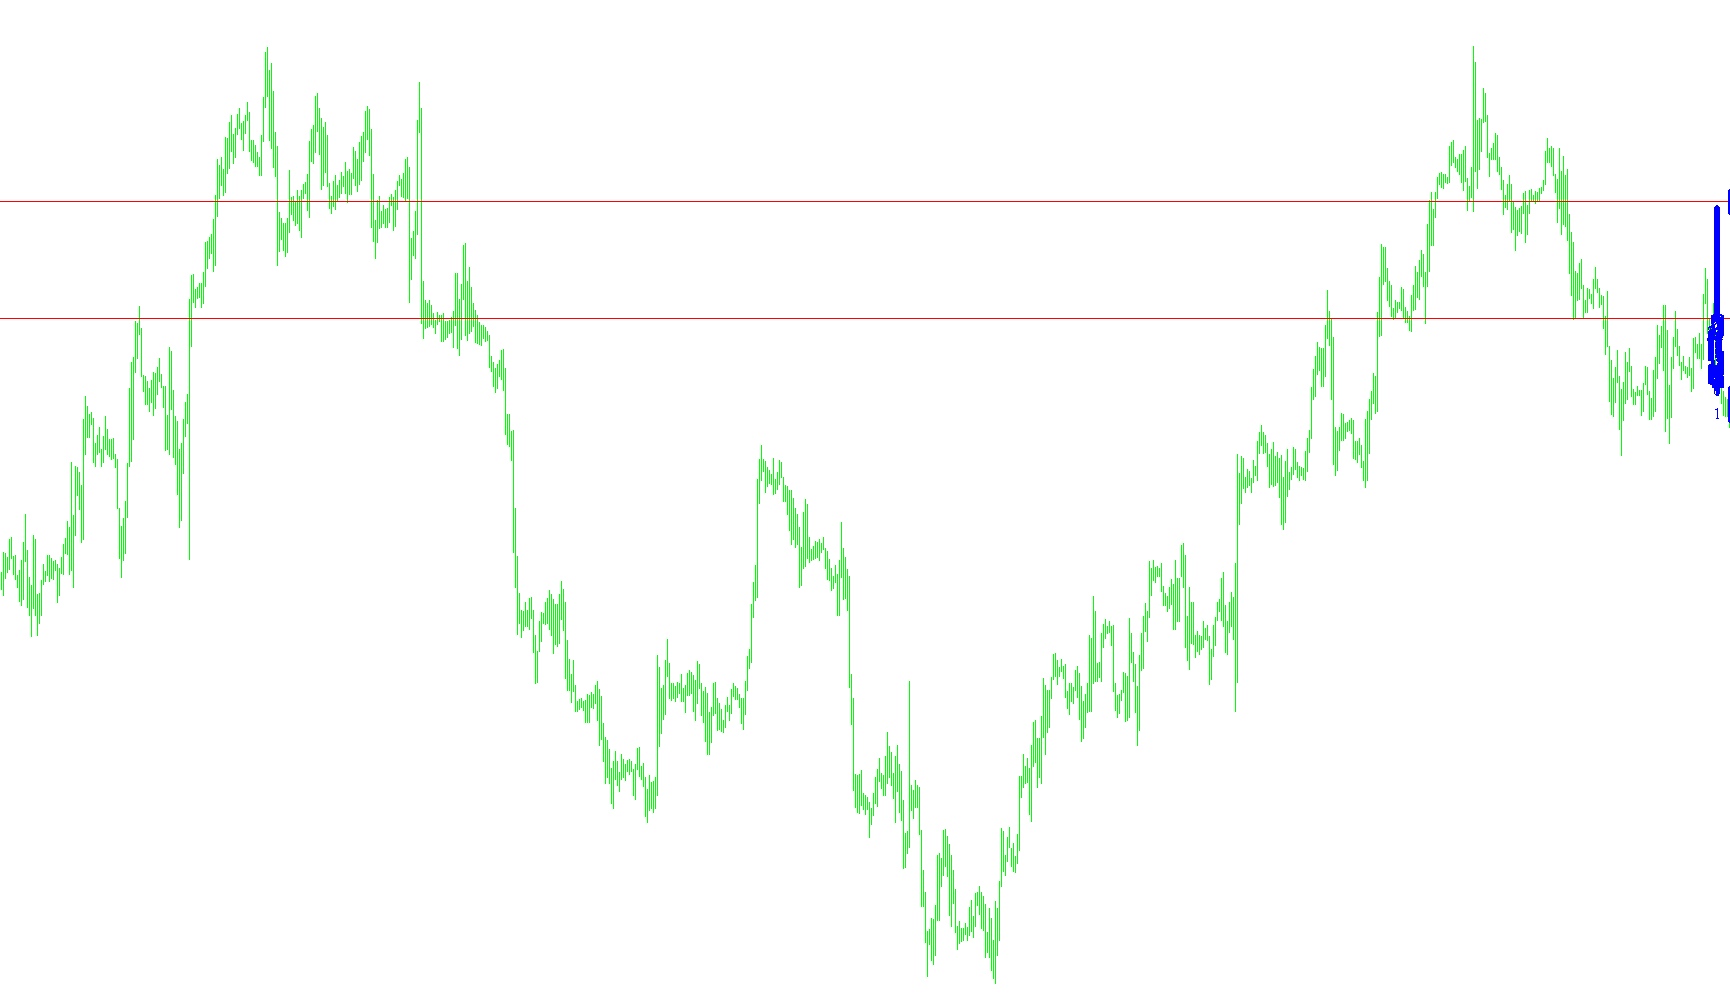
This script is designed to analyze and visualize price action over a specific timeframe on your trading chart. Instead of providing standard moving averages or trend lines, it performs a deep "heat map" style analysis of how often the market price has visited specific levels during a set period.
How the Analysis Works
The logic follows a systematic three-step process to interpret market history:
1. Defining the Lookback Period The tool begins by looking at a specific window of time based on your settings (for example, 4 hours). It scans all the candles within this timeframe to identify the absolute highest price reached and the absolute lowest price recorded. These two points establish the "trading range" for that period.
2. Mapping Price Distribution Once the boundaries are set, the script scans every single candle within that timeframe. It examines every price level between the high and the low to determine how many times the market actually "touched" or traded at those specific prices.
Think of it like a census: the script looks at every horizontal price level in the range and counts how many times the candles overlapped with that level.
3. Visualizing the Data The results are displayed directly on your chart to provide a visual representation of "Price Distribution":
- Boundary Lines: It draws two clear horizontal lines representing the high and low extremes of the selected period.
- Frequency Labels: For every price level within that range, it places a text label showing exactly how many times the price visited that specific point.
- Real-time Summary: It also calculates the total range (the distance between the high and low in points) and displays this figure as a comment on your screen.
Purpose for the Trader
The goal of this logic is to help you identify "high-activity" zones versus "low-activity" zones. By seeing where the price occurred most frequently, you can visually identify areas of heavy competition or support/resistance clusters, allowing for a clearer understanding of where the market spent the majority of its time during the specified period.
#property copyright "Copyright © 2009, Kevin Kurka"
#property link      "http://www.kurkafund.com; kurkafund@yahoo.com"

extern int Hours = 4;
extern int Munites = 0;

#property indicator_chart_window
//+------------------------------------------------------------------+
//| Custom indicator initialization function                         |
//+------------------------------------------------------------------+
int init()
  {
  ObjectsDeleteAll();
//----
   return(0);
  }
//+------------------------------------------------------------------+
//| Custom indicator deinitialization function                       |
//+------------------------------------------------------------------+
int deinit()
  {
//----

//----
   return(0);
  }
//+------------------------------------------------------------------+
//| Custom indicator iteration function                              |
//+------------------------------------------------------------------+
int start()
  {
   int    counted_bars=IndicatorCounted();
//----
   GetBars();
//----
   return(0);
  }


void GetBars(){

int BarsToCheck = Hours * 60 + Munites;
double HighPoint = High[iHighest(Symbol(),1,MODE_HIGH,BarsToCheck,0)];ObjectCreate("HighWaterMark",OBJ_HLINE,0,TimeCurrent(),HighPoint);
double LowPoint  = Low[iLowest(Symbol(),1,MODE_LOW,BarsToCheck,0)];ObjectCreate("LowWaterMark",OBJ_HLINE,0,TimeCurrent(),LowPoint);

int Range = (HighPoint - LowPoint)/Point;

Comment (Range);

int a,b;
int Occourances;
int PriceDistribution[999];

for( a=0 ; a < Range+1 ; a++ ){

   for( b=0 ; b < BarsToCheck+1 ; b++ ){
      if((LowPoint + a * Point) <= iHigh(Symbol(),1,b)  &&  (LowPoint + a * Point >= iLow(Symbol(),1,b))){
         Occourances ++;
         }
      }
      PriceDistribution[a] = Occourances;
      Print(LowPoint + a * Point," Occourances ",PriceDistribution[a]);
      ObjectCreate(DoubleToStr(LowPoint + a * Point,Digits),OBJ_TEXT,0,iTime(Symbol(),1,Occourances),(LowPoint + a * Point));
      ObjectSetText(DoubleToStr(LowPoint + a * Point,Digits),DoubleToStr(Occourances,0),12,"Times New Roman",Blue);
      Occourances =0;
}


}
Comments