Dolly_v01_v1
Download script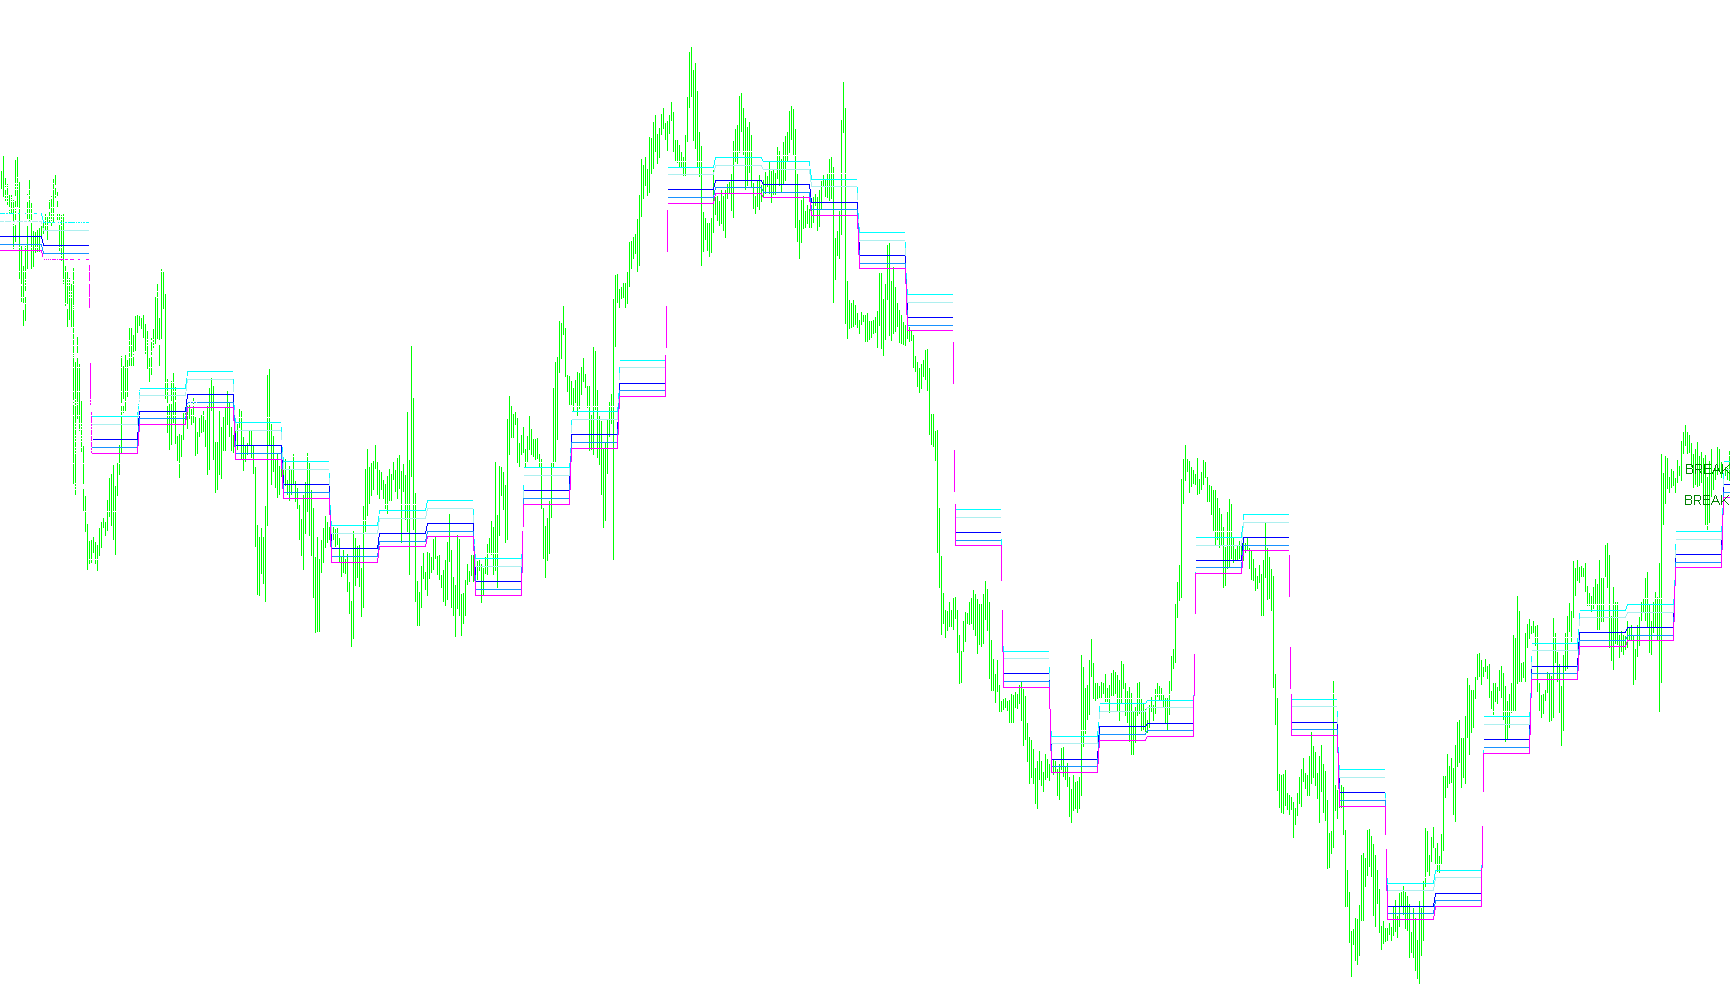
This script is a specialized trading tool designed to identify key price levels and provide actionable "Breakout Strategy" signals. It functions primarily by calculating historical price extremes and transforming them into visual zones for potential trades.
Core Functionality
The script analyzes the market to establish three primary types of data: dynamic momentum levels, standard daily pivots, and specific trade execution zones.
1. Momentum Breakout Zones
The logic automatically tracks the highest and lowest prices reached during a trading session. At the start of each new day, it calculates a "Momentum Pivot" based on the previous day's price action. From this pivot, it creates several visual boundaries:
- Primary Trading Areas: It establishes "Buy" and "Sell" areas slightly above or below the calculated pivot. These serve as immediate reaction zones.
- Breakout & Profit Targets: It projects further boundaries that represent "High Break" or "Low Break" levels. These are designed to show users where a trend might be confirming its strength and where potential take-profit points are located.
2. Daily Support and Resistance (Pivots)
In addition to the momentum zones, the script performs a standard "Daily Pivot" calculation. It looks back at the previous day's high, low, and closing prices to project today's market structure:
- Pivot Point: The central equilibrium for the current day.
- Resistance Levels (R1, R2, R3): These act as "ceilings." They represent price levels where the market may face selling pressure or encounter difficulty moving higher.
- Support Levels (S1, S2, S3): These act as "floors." They represent price levels where the market may find buying interest or struggle to drop further.
3. Automated Strategy Guidance
One of the unique features of this script is that it doesn't just draw lines; it provides a structured trading plan via an on-screen dashboard (Comment box). It translates the mathematical data into specific instructions for two different market scenarios:
- Breakout Strategy: When the price breaks out of a momentum zone, the script suggests specific "Stop" entries, where to set your "Take Profit" (TP), and where to place your "Stop Loss" (SL) to manage risk.
- Correction Strategy: If the market moves into a correction phase (a temporary pull-back), the logic provides an alternative set of instructions for entering trades based on whether the price is correcting from an upper or lower high.
Summary for the User
Essentially, this tool acts as an automated "road map" for the day. It identifies the most important price boundaries based on yesterday's performance and tells you exactly where to enter, take profit, and cut losses if the price breaks through those established levels.
/*-----------------------------+
|			       |
| Shared by www.Aptrafx.com    |
|			       |
+------------------------------*/

//+------------------------------------------------------------------+
//|                                         Dolly (the famous sheep) |
//|               original indicator is called valasholic13 v2.5.mq4 |
//|                                                                  |
//|                  and the original author is valasholic@yahoo.com |
//|                                                                  |
//|                        mods and stuff by Linuxser for Forex-TSD  |
//|                      (there is a lot of usefull code inside here)|
//|Credits: hulahula (traslation from original indonesian language)  |
//+------------------------------------------------------------------+
#property copyright ""
#property link      ""


#property indicator_chart_window
//#property indicator_separate_window
#property indicator_buffers 7
#property indicator_color1  Snow
#property indicator_width1 0
#property indicator_color2  Red
#property indicator_width2 3
#property indicator_color3  Blue
#property indicator_width3 3
#property indicator_color4  Crimson
#property indicator_width4 2
#property indicator_color5  SteelBlue
#property indicator_width5 2
#property indicator_color6  Lime
#property indicator_width6 1
#property indicator_color7  Lime
#property indicator_width7 1
//---- input parameters

//---- buffers
double PBuffer[];
double J1Buffer[];
double B1Buffer[];
double J2Buffer[];
double B2Buffer[];
double J3Buffer[];
double B3Buffer[];
string Pivot = "Pivot Point", Jual1 = "S 1", Beli1 = "R 1";
string Jual2="S 2", Beli2="R 2", Jual3="S 3", Beli3="R 3";
int fontsize = 10;
double P, J1, B1, J2, B2, J3, B3;
double LastHigh, LastLow, x;
double D4=0.55;

//+------------------------------------------------------------------+
//| Custor indicator deinitialization function                       |
//+------------------------------------------------------------------+
int deinit()
  {
  // ObjectDelete("Pivot");
   ObjectDelete("Jual1");
   ObjectDelete("Beli1");
   ObjectDelete("Jual2");
   ObjectDelete("Beli2");
   ObjectDelete("Jual3");
   ObjectDelete("Beli3");
//----
   return(0);
  }
//+------------------------------------------------------------------+
//| Custom indicator initialization function                         |
//+------------------------------------------------------------------+
int init()
  {
//---- indicator line
   SetIndexStyle(0, DRAW_NONE);
   SetIndexStyle(1, DRAW_LINE);
   SetIndexStyle(2, DRAW_LINE);
   SetIndexStyle(3, DRAW_LINE);
   SetIndexStyle(4, DRAW_LINE);
   SetIndexStyle(5, DRAW_LINE);
   SetIndexStyle(6, DRAW_LINE);
   SetIndexBuffer(0, PBuffer);
   SetIndexBuffer(1, J1Buffer);
   SetIndexBuffer(2, B1Buffer);
   SetIndexBuffer(3, J2Buffer);
   SetIndexBuffer(4, B2Buffer);
   SetIndexBuffer(5, J3Buffer);
   SetIndexBuffer(6, B3Buffer);
//---- name for DataWindow and indicator subwindow label
   //IndicatorShortName("Pivot Point");
   //SetIndexLabel(0, "Pivot Point");
//----
   SetIndexDrawBegin(0,1);
   IndicatorDigits(MarketInfo(Symbol(),MODE_DIGITS));

//----
   return(0);
  }

//+------------------------------------------------------------------+
//| Custom indicator iteration function                              |
//+------------------------------------------------------------------+
int start()

  {
   int counted_bars = IndicatorCounted();
   int limit, i;
Print(DoubleToStr(Close[i], Digits));
Print(DoubleToStr(Close[0], Digits));
Print(DoubleToStr(Close[0], Digits));

//---- indicator calculation
   if(counted_bars == 0)
     {
       x = Period();
       if(x > 240)
           return(-1);

       ///////////To Make a Line for SELL/BUY \\\\\\\\\\\\\

       //ObjectCreate("Pivot", OBJ_TEXT, 0, 0, 0);
       //ObjectSetText("Pivot", "                PIVOT", fontsize, "Arial", Black);
       ObjectCreate("Jual1", OBJ_TEXT, 0, 0, 0);
       ObjectSetText("Jual1", "                       SELL AREA", fontsize, "Arial", Green);
       ObjectCreate("Beli1", OBJ_TEXT, 0, 0, 0);
       ObjectSetText("Beli1", "                       BUY AREA", fontsize, "Arial", Green);
       ObjectCreate("Jual2", OBJ_TEXT, 0, 0, 0);
       ObjectSetText("Jual2", "                       BREAK LOW, TAKE PROFIT", fontsize, "Arial", Green);
       ObjectCreate("Beli2", OBJ_TEXT, 0, 0, 0);
       ObjectSetText("Beli2", "                       BREAK HIGH,TAKE PROFIT", fontsize, "Arial", Green);
       ObjectCreate("Jual3", OBJ_TEXT, 0, 0, 0);
       ObjectSetText("Jual3", "                       TARGET", fontsize, "Arial", Green);
       ObjectCreate("Beli3", OBJ_TEXT, 0, 0, 0);
       ObjectSetText("Beli3", "                       TARGET", fontsize, "Arial", Green);
     }
   if(counted_bars < 0)
       return(-1);
   //---- last counted bar will be recounted
   //   if(counted_bars>0) counted_bars--;
      limit = (Bars - counted_bars) - 1;
//----
   for(i = limit; i >= 0; i--)
     {
       if(High[i+1] > LastHigh)
           LastHigh = High[i+1];
       //----
       if(Low[i+1] < LastLow)
           LastLow=Low[i+1];
       if(TimeDay(Time[i]) != TimeDay(Time[i+1]))
         {
         Print(DoubleToStr(Close[i], Digits));
Print(DoubleToStr(High[0], Digits));
Print(DoubleToStr(Low[0], Digits));

//////////// Logic for determinate Momentum Break \\\\\\\\\\\\\\\\\\\\\

           P = (LastHigh + LastLow + Close[i+1]) / 3; // Logic for determinating pivot
           B1 = P + 20*Point; // Logic to determinate Buy Area (Can be change as you analize)
           J1 = P - 20*Point; // Logic to determinate Sell Area (Can be change as you analize)
           B2 = P + 40*Point; // Logic to determinate High Break Area (Can be change as you analize)
           J2 = P - 40*Point; // Logic to determinate Low Break Area (Can be change as you analize)
           B3 = P + 55*Point; // Logic to determinate High Target Area (Can be change as you analize)
           J3 = P - 55*Point; // Logic to determinate Low Target Area (Can be change as you analize)
           //Re2 = P + (LastHigh - LastLow); //This is the logic for R3
           //Su2 = P - (LastHigh - LastLow); // This is the logic for S3
           //Re3 = (2*P) + (LastHigh - (2*LastLow)); // This is the logic for R3
           //Su3 = (2*P) - ((2* LastHigh) - LastLow); //This is the logic for S3
           LastLow = Open[i];
           LastHigh = Open[i];
           //----
           //ObjectMove("Pivot", 0, Time[i], P);
           ObjectMove("Jual1", 0, Time[i], J1);
           ObjectMove("Beli1", 0, Time[i], B1);
           ObjectMove("Jual2", 0, Time[i], J2);
           ObjectMove("Beli2", 0, Time[i], B2);
           ObjectMove("Jual3", 0, Time[i], J3);
           ObjectMove("Beli3", 0, Time[i], B3);
         }
       PBuffer[i] = P;
       J1Buffer[i] = J1;
       B1Buffer[i] = B1;
       J2Buffer[i] = J2;
       B2Buffer[i] = B2;
       J3Buffer[i] = J3;
       B3Buffer[i] = B3;

//----
double rates[1][6],yesterday_close,yesterday_high,yesterday_low;
ArrayCopyRates(rates, Symbol(), PERIOD_D1);

if(DayOfWeek() == 1)
{
   if(TimeDayOfWeek(iTime(Symbol(),PERIOD_D1,1)) == 5)
   {
       yesterday_close = rates[1][4];
       yesterday_high = rates[1][3];
       yesterday_low = rates[1][2];
   }
   else
   {
      for(int d = 5;d>=0;d--)
      {
         if(TimeDayOfWeek(iTime(Symbol(),PERIOD_D1,d)) == 5)
         {
             yesterday_close = rates[d][4];
             yesterday_high = rates[d][3];
             yesterday_low = rates[d][2];
         }

      }

   }
}
else
{
    yesterday_close = rates[1][4];
    yesterday_high = rates[1][3];
    yesterday_low = rates[1][2];
}


//---- Calculate Pivots


double R = yesterday_high - yesterday_low;//range
double p = (yesterday_high + yesterday_low + yesterday_close)/3;// Standard Pivot
double r3 = (2*p)+(yesterday_high-(2*yesterday_low));
double r2 = p+(yesterday_high - yesterday_low);
double r1 = (2*p)-yesterday_low;
double s1 = (2*p)-yesterday_high;
double s2 = p-(yesterday_high - yesterday_low);
double s3 = (2*p)-((2* yesterday_high)-yesterday_low);


//----


Comment ("\n Dolly 0.1 ( BREAKOUT STRATEGY ) "
+"\n "
+"\n \n -------------------------------------------------------------------"
+"\n :::::::::::: DURING AROUND 2 BREAK ::::::::::::"
+"\n -------------------------------------------------------------------"
+"\n BUY AREA (break) :"
+"\n # BUY STOP1  "+Symbol()+" TO "+(DoubleToStr (B1Buffer[i],Digits))
+"\n Set TP "+(DoubleToStr (B2Buffer[i],Digits))+" and SL TO "+(DoubleToStr(J1Buffer[i],Digits))
+"\n # BUY STOP2  "+Symbol()+" TO "+(DoubleToStr(B2Buffer[i],Digits))
+"\n Set TP "+(DoubleToStr ((B2Buffer[i]+(10*Point)),Digits))+" and SL TO "+(DoubleToStr (B1Buffer[i],Digits))
+"\n \n SELL AREA (break) :"
+"\n # SELL STOP  "+Symbol()+" TO "+(DoubleToStr (J1Buffer[i],Digits))
+"\n Set TP "+(DoubleToStr (J2Buffer[i],Digits))+" and SL to "+(DoubleToStr (B1Buffer[i],Digits))
+"\n # SELL STOP2  "+Symbol()+" TO "+(DoubleToStr (J2Buffer[i],Digits))
+"\n Set TP "+(DoubleToStr ((J2Buffer[i]-(10*Point)),Digits))+" and SL TO "+(DoubleToStr(J1Buffer[i],Digits))

+"\n \n -------------------------------------------------------------------"
+"\n :::::::::::: WHEN PASSING THE CORRECTION ::::::::::::"
+"\n -------------------------------------------------------------------"
+"\n LOWER CORRECTION :"
+"\n # BUY STOP  "+Symbol()+" TO "+(DoubleToStr(J2Buffer[i],Digits))
+"\n Set TP "+(DoubleToStr(B1Buffer[i],Digits))+" and SL TO "+(DoubleToStr(J3Buffer[i],Digits))
+"\n \n UPPER CORRECTION :"
+"\n # SELL STOP  "+Symbol()+" TO "+(DoubleToStr(B2Buffer[i],Digits))
+"\n Set TP "+(DoubleToStr(J1Buffer[i],Digits))+" and SL TO "+(DoubleToStr(B3Buffer[i],Digits))
+"\n -------------------------------------------------------------------"
+"\n \n -------------------------------------------------------------------"
+"\n :::::: SUPPORT & RESISTANCE TODAY :::::"
+"\n -------------------------------------------------------------------"
+"\n Resistance 3 :"+(DoubleToStr(r3,Digits))
+"\n Resistance 2 :"+(DoubleToStr(r2,Digits))
+"\n Resistance 1 :"+(DoubleToStr(r1,Digits))
+"\n -------------------------------------------------------------------"
+"\n \n Pivot level :"+(DoubleToStr(p,Digits))
+"\n \n -------------------------------------------------------------------"
+"\n Support 1 :"+(DoubleToStr(s1,Digits))
+"\n Support 2 :"+(DoubleToStr(s2,Digits))
+"\n Support 3 :"+(DoubleToStr(s3,Digits))
+"\n -------------------------------------------------------------------");

//HOW TO MAKE THE PRICE LINE OF THE SUPPORT & RESISTANT APPEAR?
//WAITING FOR NEXT TIP & UP DATE


}

//----
   return(0);

  }
//+------------------------------------------------------------------+
Comments