Donchian Channels - Generalized version_v2
Download script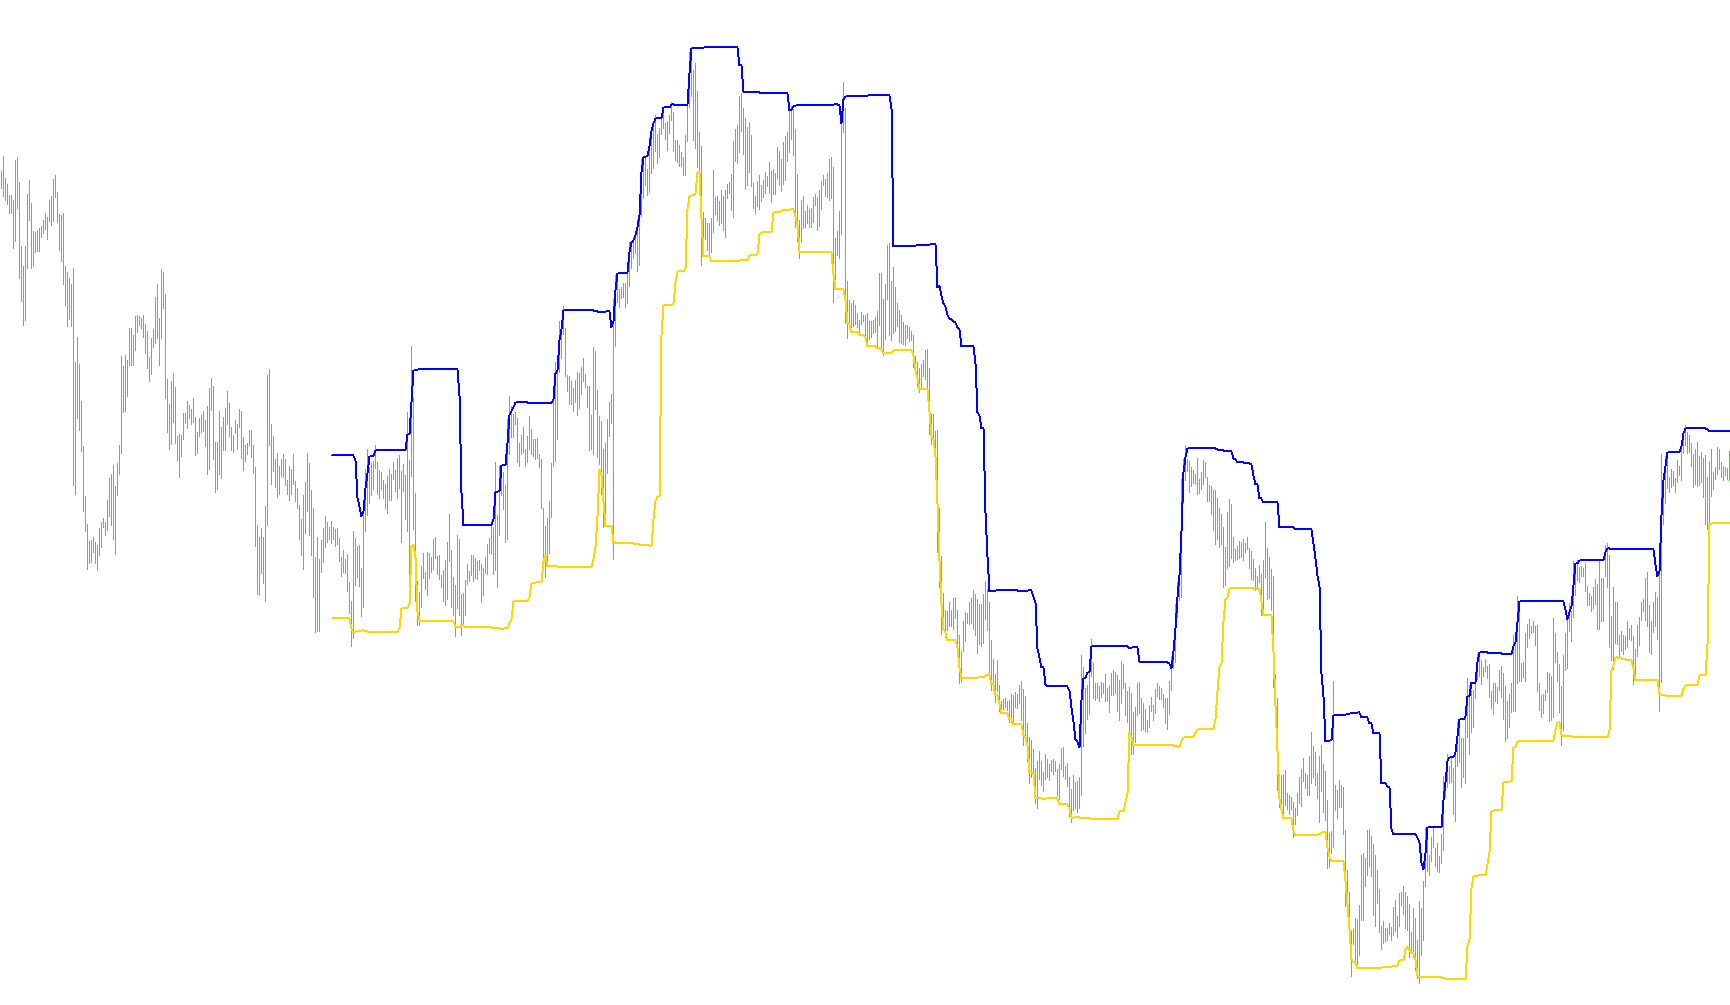
This technical tool is designed to provide traders with a visual representation of market volatility and price boundaries by calculating "Donchian Channels." In simple terms, it identifies the historical highs and lows of a specific timeframe to help map out the current trading range.
How the Logic Works
The script functions by scanning past price data to establish a "ceiling" and a "floor" for the market. Here is the breakdown of its underlying logic:
1. Historical Analysis (Periods) The tool looks back at a specific number of previous candles (the "Periods"). By analyzing this window, it determines the extreme movement of the price, allowing traders to see how much the asset has fluctuated recently.
2. Defining the Extremes Rather than just taking the absolute highest or lowest price points, the script offers different ways to interpret what constitutes an "extreme":
- It can focus on the absolute high and low prices.
- It can look at the opening price of those extreme candles (representing a more conservative concentration point).
- It can calculate a median point by averaging the opening and highest/lowest prices, providing a balanced middle ground for identifying significant price peaks and valleys.
3. Margin Adjustments Once the high and low boundaries are identified, the script applies a "Margin." This allows the user to slightly expand or contract the calculated channels. For example, it can create a buffer zone around the boundary, ensuring that the visual lines represent a specific percentage of the total range rather than just the raw data points.
4. Visual Output The final result is plotted on your chart as two distinct lines:
- The Upper Boundary: Represents the resistance level based on the calculated historical highs.
- The Lower Boundary: Represents the support level based on the calculated historical lows.
Summary for the Trader
By visualizing these boundaries, this script helps you identify when the market is reaching its "stretch" limits. It simplifies complex price history into a clear visual channel, making it easier to spot potential breakout points or areas where the price might encounter significant resistance or support.
/*-----------------------------+
|			       |
| Shared by www.Aptrafx.com    |
|			       |
+------------------------------*/

//+------------------------------------------------------------------+
//|                      Donchian Channels - Generalized version.mq4 |
//|                         Copyright © 2005, Luis Guilherme Damiani |
//|                                      http://www.damianifx.com.br |
//+------------------------------------------------------------------+
#property copyright "Copyright © 2005, Luis Guilherme Damiani"
#property link      "http://www.damianifx.com.br"

#property indicator_chart_window
#property indicator_buffers 2
#property indicator_color1 Magenta
#property indicator_color2 Magenta

//Periods: number of bars used for calculating the Donchian channel
//Extremes: if 1 uses the highest high and the lowest low -> I do not recomend using this
//			if 0 uses the open of the extremes bar -> the open point of a bar (as well as the close
//				are the points of maximum probability of concentration of the prices during the bar
//			if 3 uses the median point most extreme open and lowest low or highest high
//Margins: is the percent of the channel subtrated from the channel border before printing it, negative values are allowed
//Advance: the numbers of bars ahead
//---- input parameters
extern int       Periods=24;
extern int       Extremes=3;
extern int       Margins=-2;
extern int       Advance=0;
extern   int      max_bars=700;
//---- buffers
double ExtMapBuffer1[];
double ExtMapBuffer2[];
//+------------------------------------------------------------------+
//| Custom indicator initialization function                         |
//+------------------------------------------------------------------+
int init()
  {
//---- indicators
   SetIndexStyle(0,DRAW_LINE,1,2);
   SetIndexBuffer(0,ExtMapBuffer1);
   SetIndexStyle(1,DRAW_LINE,1,2);
   SetIndexBuffer(1,ExtMapBuffer2);

//----
   return(0);
  }
//+------------------------------------------------------------------+
//| Custor indicator deinitialization function                       |
//+------------------------------------------------------------------+
int deinit()
  {
//----

//----
   return(0);
  }
//+------------------------------------------------------------------+
//| Custom indicator iteration function                              |
//+------------------------------------------------------------------+
int start()
{
   int    fixed_bars=IndicatorCounted();
   //----

   //int shift=0;//, cnt(0), loopbegin(0);
   double smin=0, smax=0, SsMax=0, SsMin=0;
   //Variables : bar(0), prevbars(0), start(0), cs(0), prevcs(0),commodt(0);

   for (int shift=0;shift< max_bars;shift++)
   {
	  if (Extremes ==1)
	  {
		 SsMax = High[Highest(NULL,0,MODE_HIGH,Periods,shift)];
		 SsMin = Low[Lowest(NULL,0,MODE_LOW,Periods,shift)];
	  }
	  else if (Extremes == 3)
	  {
		 SsMax = (Open[Highest(NULL,0,MODE_OPEN,Periods,shift)]+High[Highest(NULL,0,MODE_HIGH,Periods,shift)])/2;
		 SsMin = (Open[Lowest(NULL,0,MODE_OPEN,Periods,shift)]+Low[Lowest(NULL,0,MODE_LOW,Periods,shift)])/2;
	  }
	     else
	  {
		SsMax = Open[Highest(NULL,0,MODE_OPEN,Periods,shift)];
		SsMin = Open[Lowest(NULL,0,MODE_OPEN,Periods,shift)];
	  }
	  smin = SsMin+(SsMax-SsMin)*Margins/100;
	  smax = SsMax-(SsMax-SsMin)*Margins/100;
	  ExtMapBuffer1[shift-Advance]=smin;
	  ExtMapBuffer2[shift-Advance]=smax;
   }
//----
   return(0);
  }
//+------------------------------------------------------------------+
Comments