DoubleCCI_Woodies_v4
Download script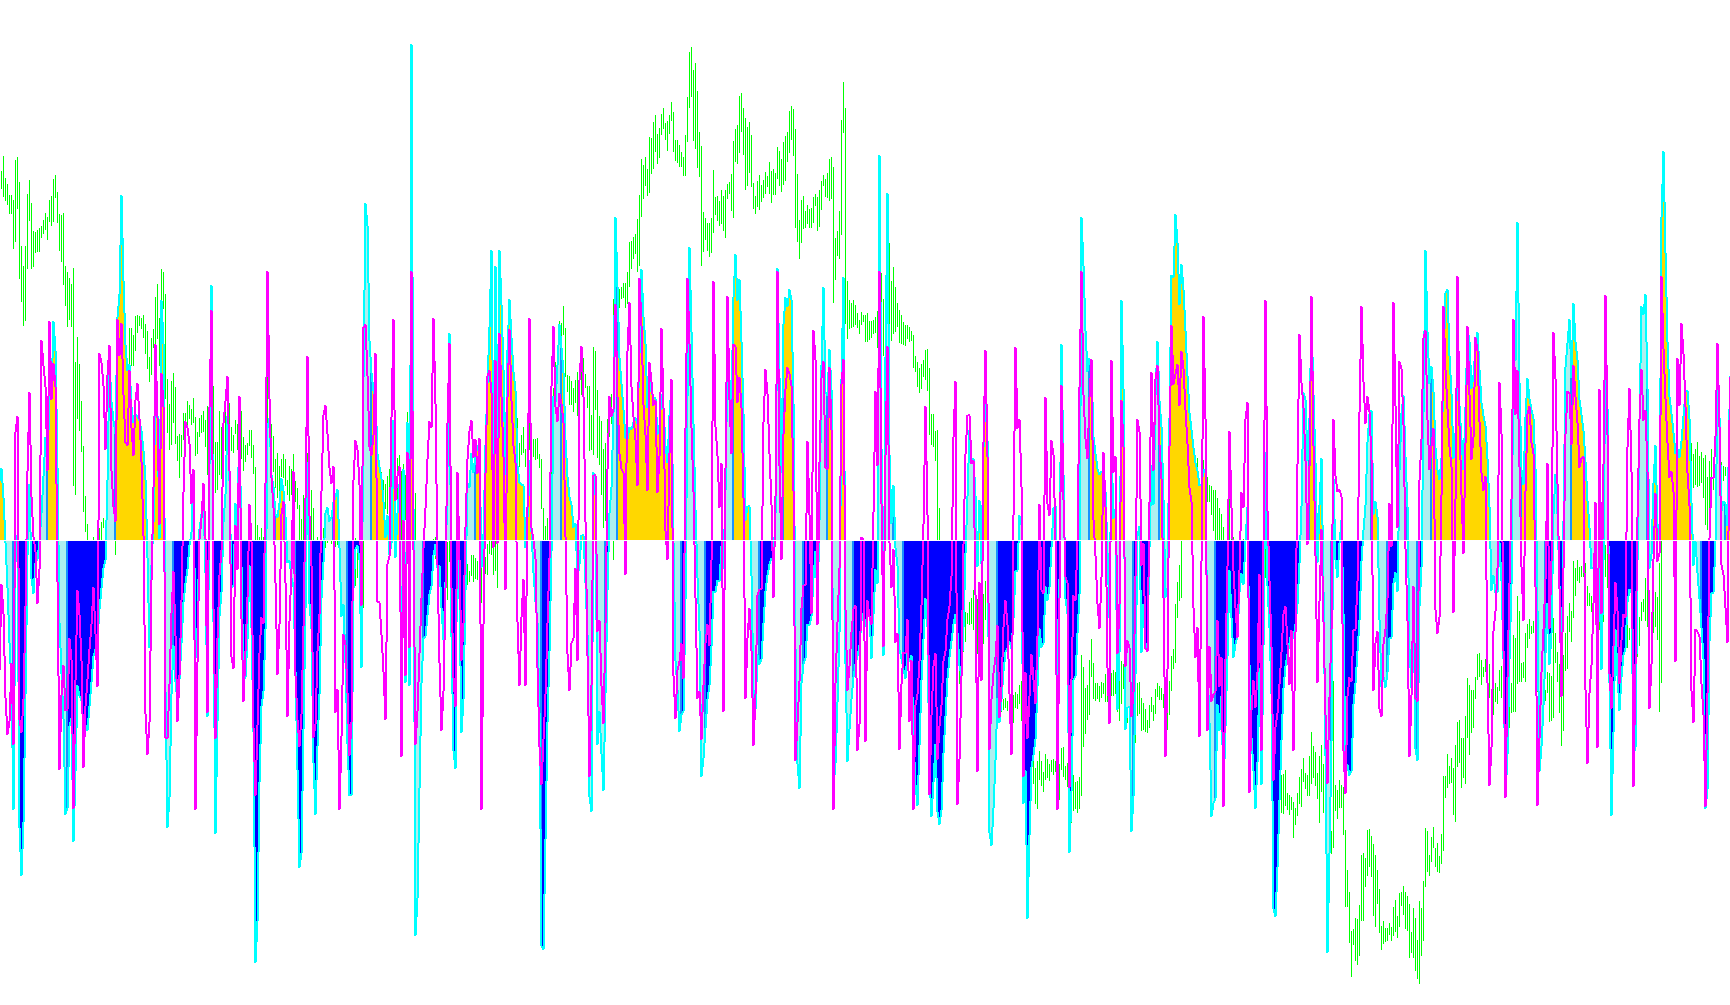
The DoubleCCI Woodies is a sophisticated technical analysis tool designed to help traders identify market trends and potential entry points by utilizing two different variations of the Commodity Channel Index (CCI). By combining these two perspectives, the script filters out "market noise" to provide a clearer picture of where the price is heading.
Core Logic and Functionality
1. Dual CCI Analysis The indicator operates on two distinct layers:
- Trend CCI: This serves as the "macro" filter. It uses a longer time period to determine the overall direction of the market. It acts as your primary compass, telling you if the broader market is in an uptrend or downtrend.
- Entry CCI: This serves as the "micro" trigger. It uses a shorter time period to react more quickly to price fluctuations. It helps identify specific moments when the price might be ready to move in the direction of the established trend.
2. Dynamic Timeframe Adaptation One of the sophisticated features of this script is its ability to be context-aware. Users can enable an "Automatic Timeframe Setting." When turned on, the script automatically adjusts its internal sensitivity settings based on the chart you are currently viewing (e.g., adjusting its logic differently for a 1-minute chart versus a Daily chart). This ensures that the indicator remains relevant regardless of whether you are day trading or swing trading.
3. Trend Visualization and State Management The script doesn't just show two lines; it interprets their behavior to categorize market states:
- Trend Identification: The logic tracks how many consecutive bars the "Trend CCI" remains above or below the zero line.
- Transition Tracking: It monitors for specific "breakthroughs." Once the Trend CCI stays consistently on one side of the zero line for a set period, the script identifies this as a confirmed trend and highlights it visually.
- Visual Feedback: Instead of just lines, the tool uses histograms and color-coded bars to represent different states: active uptrends, active downtrends, "no-trend" zones (where the market is sideways or indecisive), and specific time-bar milestones.
4. Real-Time Alerts To ensure traders don't have to watch the screen constantly, the script includes an intelligent alert system. It monitors for a specific synchronization event: when both the Trend CCI and the Entry CCI cross the zero line simultaneously.
- If both cross above zero, it signals a coordinated move into an uptrend.
- If both cross below zero, it signals a coordinated move into a downtrend. The script is designed to only trigger one alert per candle to prevent repetitive notifications during high-volatility periods.
Summary for the Trader
Think of this tool as a "Double Filter." The Trend CCI tells you which way the tide is pulling (Up or Down), while the Entry CCI tells you when the wave is about to break. By looking for moments where both indicators align, the script helps traders avoid "fake-outs" and focus on high-probability movements that have momentum in both the short and long term.
//+------------------------------------------------------------------+
//|                                            DoubleCCI_Woodies.mq4 |
//|                   Copyright © 2005, Jason Robinson (jnrtrading). |
//|                                   http://www.spreadtrade2win.com |
//+------------------------------------------------------------------+
#property copyright "Copyright © 2005, Jason Robinson (jnrtrading)."
#property link      "http://www.spreadtrade2win.com"

#property indicator_separate_window
#property indicator_buffers 7
#property indicator_color1 Green
#property indicator_color2 Red
#property indicator_color3 Black
#property indicator_color4 Gold
#property indicator_color5 Blue
#property indicator_color6 Gray
#property indicator_color7 Gold
#property indicator_level1 100  //50
#property indicator_level2 180
#property indicator_level3 250
#property indicator_level4 350
#property indicator_level5 -350
#property indicator_level6 -250
#property indicator_level7 -180
#property indicator_level8 -100
#property indicator_width1 2
#property indicator_width2 2
#property indicator_width3 2
#property indicator_width4 2
#property indicator_width5 2
#property indicator_width6 2
#property indicator_width7 1

//---- input parameters
extern int TrendCCI_Period = 14;
extern int EntryCCI_Period = 6;
extern bool Zero_Cross_Alert;
extern bool Automatic_Timeframe_Setting = false;
extern int M1_TrendCCI_Period = 50;
extern int M1_EntryCCI_Period = 14;
extern int M5_TrendCCI_Period = 50;
extern int M5_EntryCCI_Period = 14;
extern int M15_TrendCCI_Period = 14;
extern int M15_EntryCCI_Period = 6;
extern int M30_TrendCCI_Period = 14;
extern int M30_EntryCCI_Period = 6;
extern int H1_TrendCCI_Period = 14;
extern int H1_EntryCCI_Period = 6;
extern int H4_TrendCCI_Period = 14;
extern int H4_EntryCCI_Period = 6;
extern int D1_TrendCCI_Period = 14;
extern int D1_EntryCCI_Period = 6;
extern int W1_TrendCCI_Period = 14;
extern int W1_EntryCCI_Period = 6;
extern int MN_TrendCCI_Period = 14;
extern int MN_EntryCCI_Period = 6;


double TrendCCI[];
double EntryCCI[];
double CCITrendUp[];
double CCITrendDown[];
double CCINoTrend[];
double CCITimeBar[];
double ZeroLine[];

int trendUp, trendDown;

//+------------------------------------------------------------------+
//| Custom indicator initialization function                         |
//+------------------------------------------------------------------+
int init()  {
//---- indicators
   SetIndexStyle(4, DRAW_LINE, STYLE_SOLID, 2);
   SetIndexBuffer(4, TrendCCI);
   SetIndexLabel(4, "TrendCCI");
   SetIndexStyle(0, DRAW_HISTOGRAM, 0, 2);  //1
   SetIndexBuffer(0, CCITrendUp);
   SetIndexStyle(1, DRAW_HISTOGRAM, 0, 2);
   SetIndexBuffer(1, CCITrendDown);
   SetIndexStyle(2, DRAW_HISTOGRAM, 0, 2);
   SetIndexBuffer(2, CCINoTrend);
   SetIndexStyle(3, DRAW_HISTOGRAM, 0, 2);
   SetIndexBuffer(3, CCITimeBar);
   SetIndexStyle(5, DRAW_LINE, STYLE_SOLID, 2);
   SetIndexBuffer(5, EntryCCI);
   SetIndexLabel(5, "EntryCCI");
   SetIndexStyle(6, DRAW_LINE, STYLE_SOLID, 1);
   SetIndexBuffer(6, ZeroLine);
//----
   return(0);
  }
//+------------------------------------------------------------------+
//| Custor indicator deinitialization function                       |
//+------------------------------------------------------------------+
int deinit()
  {
//----

//----
   return(0);
  }
//+------------------------------------------------------------------+
//| Custom indicator iteration function                              |
//+------------------------------------------------------------------+
int start() {

   int limit, i, trendCCI, entryCCI;
   int counted_bars = IndicatorCounted();
   static datetime prevtime = 0;
//---- check for possible errors
   if(counted_bars < 0) return(-1);
//---- last counted bar will be recounted
   if(counted_bars > 0) counted_bars--;

   limit=Bars;//-counted_bars;

   if (Automatic_Timeframe_Setting == true) {
      switch(Period()) {
         case 1: trendCCI = M1_TrendCCI_Period; entryCCI = M1_EntryCCI_Period; break;
         case 5: trendCCI = M5_TrendCCI_Period; entryCCI = M5_EntryCCI_Period; break;
         case 15: trendCCI = M15_TrendCCI_Period; entryCCI = M15_EntryCCI_Period; break;
         case 30: trendCCI = M30_TrendCCI_Period; entryCCI = M30_EntryCCI_Period; break;
         case 60: trendCCI = H1_TrendCCI_Period; entryCCI = H1_EntryCCI_Period; break;
         case 240: trendCCI = H4_TrendCCI_Period; entryCCI = H4_EntryCCI_Period; break;
         case 1440: trendCCI = D1_TrendCCI_Period; entryCCI = D1_EntryCCI_Period; break;
         case 10080: trendCCI = W1_TrendCCI_Period; entryCCI = W1_EntryCCI_Period; break;
         case 43200: trendCCI = MN_TrendCCI_Period; entryCCI = MN_EntryCCI_Period; break;
      }
   }
   else {
      trendCCI = TrendCCI_Period;
      entryCCI = EntryCCI_Period;
   }
      IndicatorShortName("(TrendCCI: " + trendCCI + ", EntryCCI: " + entryCCI + ") ");

   for(i = limit; i >= 0; i--) {
      CCINoTrend[i] = 0;
      CCITrendDown[i] = 0;
      CCITimeBar[i] = 0;
      CCITrendUp[i] = 0;
      ZeroLine[i] = 0;
      TrendCCI[i] = iCCI(NULL, 0, trendCCI, PRICE_TYPICAL, i);
      EntryCCI[i] = iCCI(NULL, 0, entryCCI, PRICE_TYPICAL, i);

      if(TrendCCI[i] > 0 && TrendCCI[i+1] < 0) {
         if (trendDown > 4) trendUp = 0;
      }
      if (TrendCCI[i] > 0) {
         if (trendUp < 5){
            CCINoTrend[i] = TrendCCI[i];
            trendUp++;
         }
         if (trendUp == 5) {
            CCITimeBar[i] = TrendCCI[i];
            trendUp++;
         }
         if (trendUp > 5) {
            CCITrendUp[i] = TrendCCI[i];
         }
      }
      if(TrendCCI[i] < 0 && TrendCCI[i+1] > 0) {
         if (trendUp > 4) trendDown = 0;
      }
      if (TrendCCI[i] < 0) {

         if (trendDown < 5){
            CCINoTrend[i] = TrendCCI[i];
            trendDown++;
         }
         if (trendDown == 5) {
            CCITimeBar[i] = TrendCCI[i];
            trendDown++;
         }
         if (trendDown > 5) {
            CCITrendDown[i] = TrendCCI[i];
         }
      }
   }

   if (Zero_Cross_Alert == true) {
      if (prevtime == Time[0]) {
         return(0);
      }
      else {
         if(EntryCCI[0] < 0) {
            if((TrendCCI[0] < 0) && (TrendCCI[1] >= 0)) {
               Alert(Symbol(), " M", Period(), " Trend & Entry CCI Have both crossed below zero");
            }
         }
         else if(EntryCCI[0] > 0) {
            if((TrendCCI[0] > 0) && (TrendCCI[1] <= 0)) {
               Alert(Symbol(), " M", Period(), " Trend & Entry CCI Have both crossed above zero");
            }
         }
         prevtime = Time[0];
      }
   }
//----

//----
   return(0);
  }
//+------------------------------------------------------------------+
Comments