ds_HDiv_OsMA_01
Download script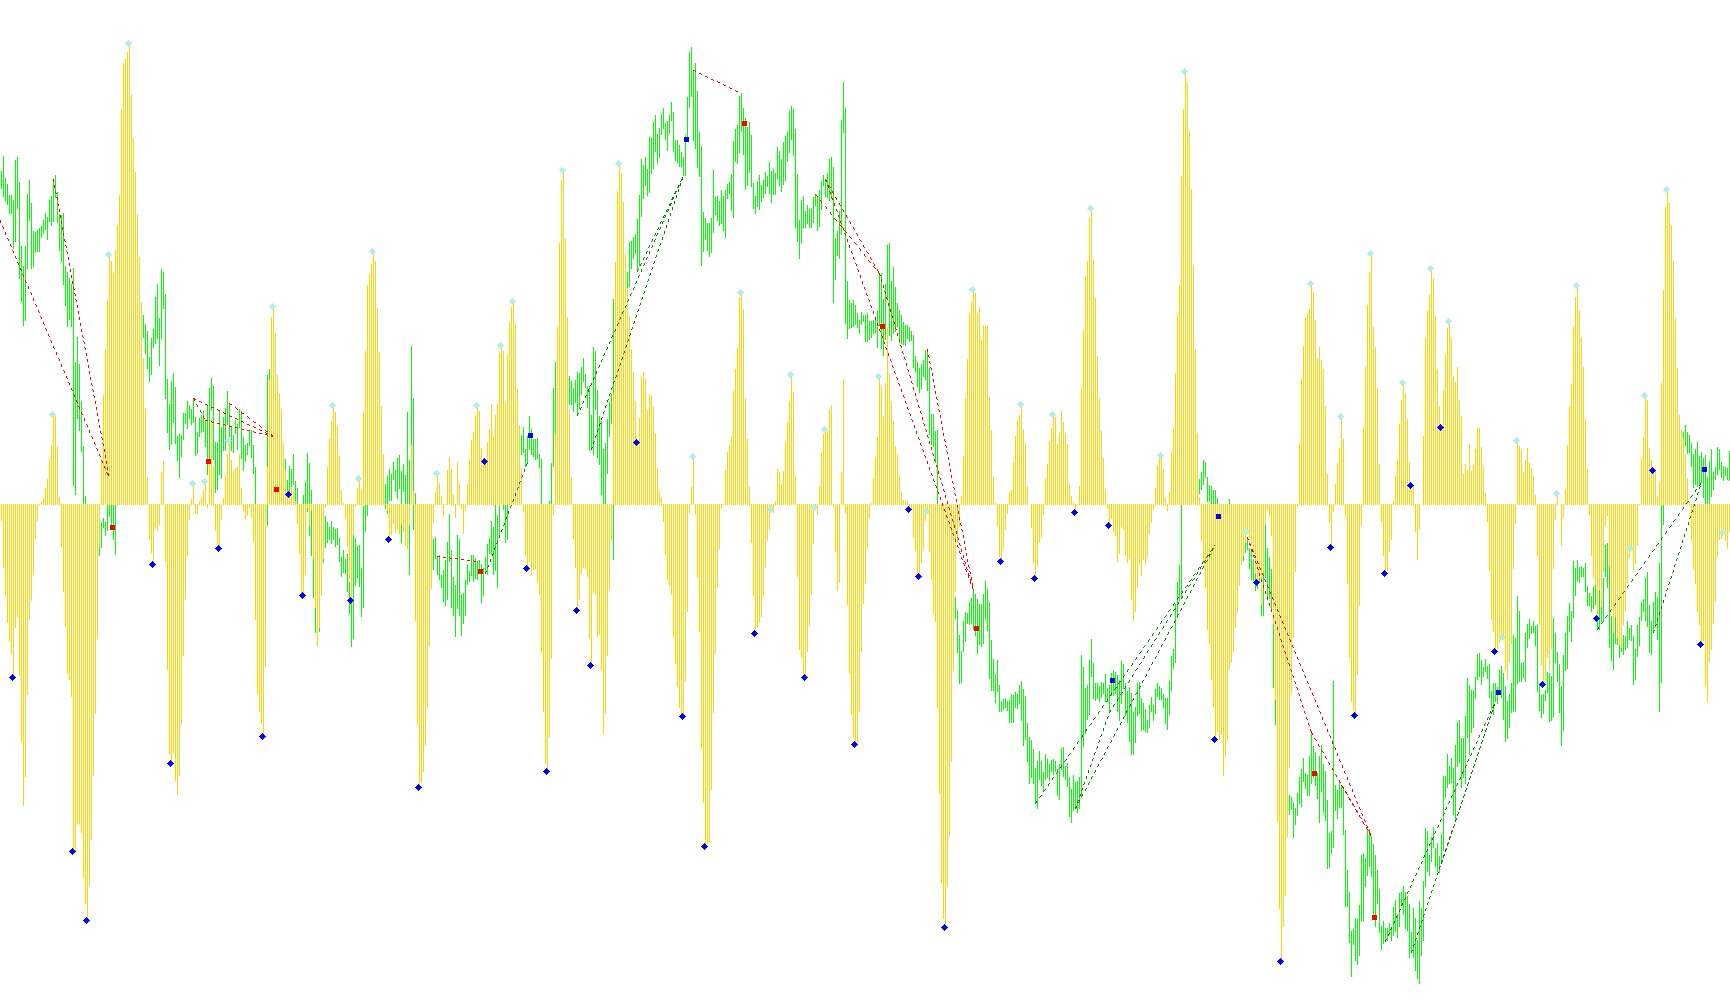
This script is designed as a sophisticated technical analysis tool that monitors price movements to identify specific momentum shifts and trend exhaustion. It combines several layers of calculation—ranging from moving averages to geometric pattern recognition—to highlight potential entry or exit points on a trading chart.
Core Calculation Logic
The foundation of the tool relies on a customized oscillator. It begins by calculating two different types of "Moving Averages" based on the closing prices of candles. By subtracting one from the other, it creates a baseline momentum value (similar to a MACD).
To further refine this data, the script then calculates a "Signal Line"—an average of that momentum value—and subtracts it again. The final result is displayed as a histogram in a separate window. This process effectively filters out minor market noise, leaving a smoother representation of the underlying market sentiment.
Peak and Trough Identification
Once the main oscillator is established, the script scans for specific "Fractal" points. Rather than just looking for any high or low point, it looks for significant structural peaks and valleys within the oscillator's movement:
- High Points: It identifies local tops where the oscillator has reached a peak relative to the candles immediately preceding and following it.
- Low Points: It identifies local bottoms where the oscillator has dipped significantly compared to its surrounding environment.
These points act as "landmarks" that the script uses to measure the relationship between price action and momentum.
Divergence Detection
The most advanced feature of this logic is its ability to detect Divergence. This occurs when the price of the asset and the momentum shown on the oscillator are moving in different directions. The script automatically scans back through history to find these discrepancies:
- Bearish Divergence: If the price reaches a higher peak than before, but the oscillator's "landmark" peak is lower, it suggests that the upward move is losing steam.
- Bullish Divergence: If the price reaches a lower trough than before, but the oscillator's "landmark" trough is higher, it suggests that the downward move is weakening.
Visual Output
When the script identifies these divergences, it performs three automated visual actions:
- Trend Lines on Price: It draws a line directly on the main price chart connecting the high/low points to show where the price has broken character.
- Trend Lines on Indicator: It simultaneously draws a corresponding line in the indicator window to show the momentum's path.
- Alert Arrows: It places visual arrows on the chart to pinpoint exactly where the divergence was confirmed, providing a clear signal for the user to notice.
In summary, this tool is designed to find moments where the "strength" of a move no longer matches its "price," potentially signaling that a trend is about to reverse or exhaust itself.
//+------------------------------------------------------------------
//    															  ds_HDiv_OsMA.mq4
//												   			  dolsergon@yandex.ru
//														         icq(qip)-366382375
//+------------------------------------------------------------------+
//|                                                         OsMA.mq4 |
//|                      Copyright © 2004, MetaQuotes Software Corp. |
//|                                       http://www.metaquotes.net/ |
//+------------------------------------------------------------------+
#property  copyright "Copyright © 2004, MetaQuotes Software Corp."
#property  link      "http://www.metaquotes.net/"
//---- indicator settings
#property  indicator_separate_window
#property  indicator_buffers 3
#property  indicator_color1  Silver
#property  indicator_width1  2
#property  indicator_color2  Blue
#property  indicator_width2  1
#property  indicator_color3  Orange
#property  indicator_width3  1
//---- indicator parameters
extern int FastEMA=12;
extern int SlowEMA=26;
extern int SignalSMA=9;

extern int FractRightBars = 1;	// êîë-âî áàð ñïðàâà (ôðàêòàë)
extern int FractLeftBars = 4;		// êîë-âî áàð ñëåâà (ôðàêòàë)
extern int MaxFanSize = 3;			// ìàêñ. êîë-âî ëèíèé â "âååðå"


//---- indicator buffers
double     OsmaBuffer[];
double     MacdBuffer[];
double     SignalBuffer[];
double		FrUpBuffer[];
double		FrDnBuffer[];

string IndName;

//=======================================================================================================================================================================
int init()
  {
//---- 2 additional buffers are used for counting.
   IndicatorBuffers(5);
//---- drawing settings
   SetIndexStyle(0,DRAW_HISTOGRAM);
   SetIndexDrawBegin(0,SignalSMA);
   IndicatorDigits(Digits+2);
//---- 3 indicator buffers mapping
   SetIndexBuffer(0,OsmaBuffer);

   SetIndexBuffer(1, FrDnBuffer);
   SetIndexStyle(1, DRAW_ARROW);
   SetIndexArrow(1, 119);
   SetIndexEmptyValue(1, 0.0);

   SetIndexBuffer(2, FrUpBuffer);
   SetIndexStyle(2, DRAW_ARROW);
   SetIndexArrow(2, 119);
   SetIndexEmptyValue(2, 0.0);

   SetIndexBuffer(3,MacdBuffer);
   SetIndexBuffer(4,SignalBuffer);
//---- name for DataWindow and indicator subwindow label
	IndName = "ds_HDiv_OsMA("+FastEMA+","+SlowEMA+","+SignalSMA+")";
   IndicatorShortName(IndName);
//---- initialization done
   return(0);
  }


//=======================================================================================================================================================================
void deinit() {

	ObjectsDeleteAll();
}


//=======================================================================================================================================================================
//| Moving Average of Oscillator                                     |
int start()
  {
   int limit;
   int counted_bars=IndicatorCounted();
//---- last counted bar will be recounted
   if(counted_bars>0) counted_bars--;
   limit=Bars-counted_bars;
//---- macd counted in the 1-st additional buffer
   for(int i=0; i<limit; i++)
      MacdBuffer[i]=iMA(NULL,0,FastEMA,0, MODE_EMA, PRICE_CLOSE, i)-iMA(NULL,0,SlowEMA,0,MODE_EMA, PRICE_CLOSE, i);
//---- signal line counted in the 2-nd additional buffer
   for(i=0; i<limit; i++)
      SignalBuffer[i]=iMAOnArray(MacdBuffer,Bars,SignalSMA,0,MODE_SMA,i);
//---- main loop
   for(i=0; i<limit; i++)
      OsmaBuffer[i]=MacdBuffer[i]-SignalBuffer[i];
//---- done


// FRACTALS -------------------------------------------------------------------------------------------------------------------------------------------------------------

	//-------------------------------------------------------------------------------------

	int l_bars, r_bars;
	int p;
	double v, v2;

   for(i=1+FractRightBars; i<limit; i++) {

		l_bars = 0;
		r_bars = 0;
		v = OsmaBuffer[i];
		for (p=1; p<=FractLeftBars; p++) {
			if (OsmaBuffer[i+p] > v) {
				l_bars++;
				v = OsmaBuffer[i+p];
			} else    break;
		}
		v = OsmaBuffer[i];
		for (p=1; p<=FractRightBars; p++) {
			if (OsmaBuffer[i-p] >= v) {
				r_bars++;
				v = OsmaBuffer[i-p];
			} else    break;
		}
		if ( (l_bars == FractLeftBars) && (r_bars == FractRightBars)) {
			FrDnBuffer[i] = OsmaBuffer[i];
		}


		l_bars = 0;
		r_bars = 0;
		v = OsmaBuffer[i];
		for (p=1; p<=FractLeftBars; p++) {
			if (OsmaBuffer[i+p] < v) {
				l_bars++;
				v = OsmaBuffer[i+p];
			} else    break;
		}
		v = OsmaBuffer[i];
		for (p=1; p<=FractRightBars; p++) {
			if (OsmaBuffer[i-p] <= v) {
				r_bars++;
				v = OsmaBuffer[i-p];
			} else    break;
		}
		if ( (l_bars == FractLeftBars) && (r_bars == FractRightBars)) {
			FrUpBuffer[i] = OsmaBuffer[i];
		}


	}


// DIVERGENCE -----------------------------------------------------------------------------------------------------------------------------------------------------------

	int PointsOffset = 9;

   for(p=1+FractRightBars; p<limit; p++) {


		if (FrUpBuffer[p] != 0) {
			int count = 0;

	   	for(i=FractLeftBars+p; i<Bars; i++) {
				if (FrUpBuffer[i] != 0) {

					if ( (FrUpBuffer[i] < FrUpBuffer[p]) && (High[i] > High[p]) ) {
							DrawIndicatorTrendLine(Time[i], Time[p], OsmaBuffer[i], OsmaBuffer[p], Red, 2);
							DrawPriceTrendLine(Time[i], Time[p], High[i], High[p], Red, 2);
							DrawPriceArrow(Time[p-2], Open[p-2]+PointsOffset*Point, Red, 167);
							count++;
							if (count >= MaxFanSize)    break;
					}	else    break;

				}
			}
		}

		if (FrDnBuffer[p] != 0) {
			count = 0;

	   	for(i=FractLeftBars+p; i<Bars; i++) {
				if (FrDnBuffer[i] != 0) {

					if ( (FrDnBuffer[i] > FrDnBuffer[p]) && (Low[i] < Low[p]) ) {
							DrawIndicatorTrendLine(Time[i], Time[p], OsmaBuffer[i], OsmaBuffer[p], Green, 2);
							DrawPriceTrendLine(Time[i], Time[p], Low[i], Low[p], Green, 2);
							DrawPriceArrow(Time[p-2], Open[p-2]+PointsOffset*Point, Blue, 167);
							count++;
							if (count >= MaxFanSize)    break;
					}	else    break;

				}
			}
		}

	}


   return(0);
  }

//=======================================================================================================================================================================
void DrawPriceTrendLine(datetime x1, datetime x2, double y1,
                        double y2, color lineColor, double style)
  {
   string label = "DivergLine# " + DoubleToStr(x1+x2, 0);
   ObjectDelete(label);
   ObjectCreate(label, OBJ_TREND, 0, x1, y1, x2, y2, 0, 0);
   ObjectSet(label, OBJPROP_RAY, 0);
   ObjectSet(label, OBJPROP_COLOR, lineColor);
   ObjectSet(label, OBJPROP_STYLE, style);
  }

//=======================================================================================================================================================================
void DrawIndicatorTrendLine(datetime x1, datetime x2, double y1,
                            double y2, color lineColor, double style)
  {
   int indicatorWindow = WindowFind(IndName);
   if(indicatorWindow < 0)
       return;
   string label = "DivergLine$# " + DoubleToStr(x1+x2, 0);
   ObjectDelete(label);
   ObjectCreate(label, OBJ_TREND, indicatorWindow, x1, y1, x2, y2, 0, 0);
   ObjectSet(label, OBJPROP_RAY, 0);
   ObjectSet(label, OBJPROP_COLOR, lineColor);
   ObjectSet(label, OBJPROP_STYLE, style);
  }

//=======================================================================================================================================================================
void DrawPriceArrow(datetime x1, double y1, color Color, double style)
  {
   string label = "DivergArrow# " + DoubleToStr(x1, 0);
   ObjectDelete(label);
   ObjectCreate(label, OBJ_ARROW, 0, x1, y1);
   ObjectSet(label, OBJPROP_ARROWCODE, style);
   ObjectSet(label, OBJPROP_COLOR, Color);
  }
Comments