DT_ZZ_001
Download script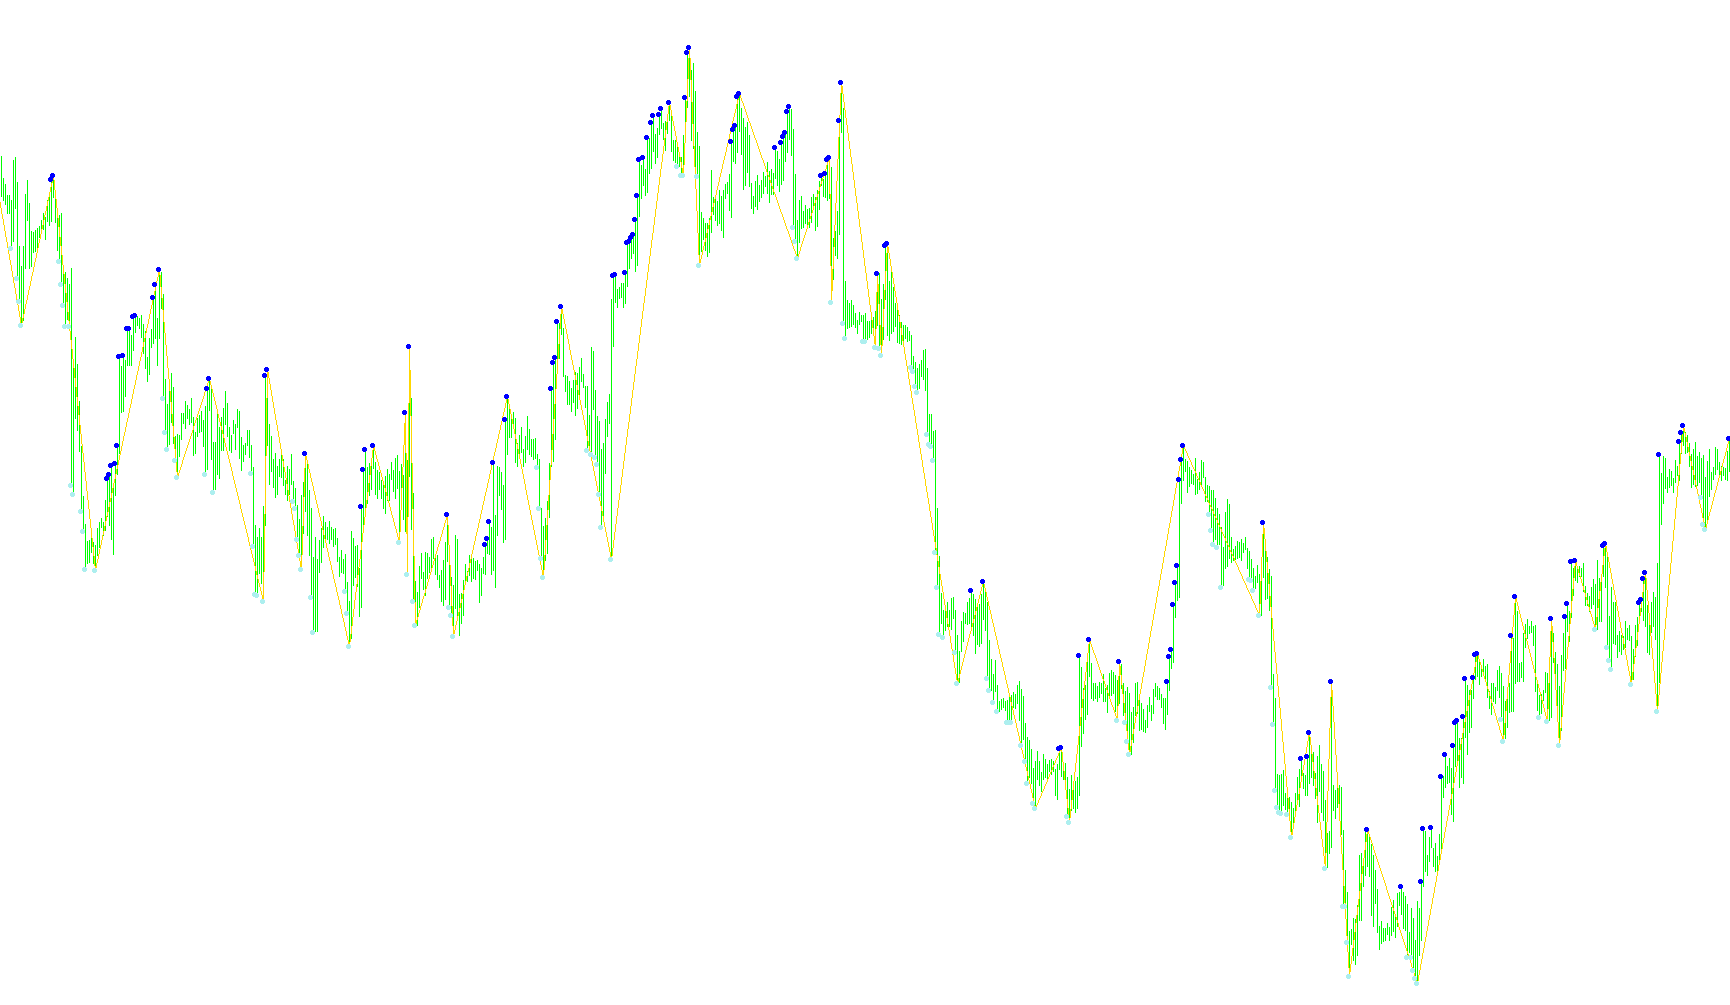
This tool is designed to identify and visualize significant price turning points on a trading chart by highlighting historical "highs" and "lows." Rather than showing every minor price fluctuation, the script filters the data to highlight only the most structurally relevant peaks and valleys based on a user-defined depth.
Core Logic Overview
The script operates by scanning the market history to identify local price extremes. It uses a specific look-back period (defined by the "Depth" setting) to determine what constitutes a significant high or low. The logic follows a sequential flow:
- Dynamic Scanning: The script moves backward through the price history, constantly evaluating the highest and lowest prices within its designated depth window.
- Peak and Valley Identification: It compares the current price movement against previous data points. When the price breaks out of a previous range to form a new local high or low, the script flags it.
- Conflict Resolution & Filtering: To ensure the chart remains clean and only shows meaningful levels, the script includes a "validation" step. If multiple peaks or valleys occur in close proximity, the logic compares them against each other. It essentially identifies the most prominent extreme point in a specific price wave while neutralizing or ignoring secondary fluctuations that don't represent the true structural trend.
- Visual Representation: Once a valid peak (High) or valley (Low) is confirmed, the script marks these points on your chart. These markers act as visual anchors, helping you see where the market momentum shifted in the past.
How it behaves on the chart
- Trend Recognition: By highlighting these significant peaks and valleys, the tool helps visualize the "skeleton" of price action.
- Clean Visualization: Because it filters out minor noise, it prevents the chart from becoming cluttered with excessive markings, focusing your attention only on the most impactful price levels.
- Historical Context: It provides a clear history of where price has reached its extremes, allowing you to see how the market has reacted to previous support and resistance levels over time.
Miscellaneous
15
Views
0
Downloads
0
Favorites
DT_ZZ_001
//+------------------------------------------------------------------+
//|                                                        DT_ZZ.mq4 |
//+------------------------------------------------------------------+
#property copyright "Copyright © 2006, klot."
#property link      "klot@mail.ru"

#property indicator_chart_window
#property indicator_buffers 3
#property indicator_color1 Aqua
#property indicator_color2 Blue
#property indicator_color3 Red
//---- indicator parameters
extern int ExtDepth=12;
//---- indicator buffers
double zzL[];
double zzH[];
double zz[];

//+------------------------------------------------------------------+
//| Custom indicator initialization function                         |
//+------------------------------------------------------------------+
int init()
  {
 //  IndicatorBuffers(3);
//---- drawing settings
   SetIndexStyle(2,DRAW_ARROW);
   SetIndexStyle(1,DRAW_ARROW);
   SetIndexStyle(0,DRAW_SECTION);
   SetIndexArrow(2,159);
   SetIndexArrow(1,159);
//---- indicator buffers mapping
   SetIndexBuffer(0,zz);
   SetIndexBuffer(1,zzH);
   SetIndexBuffer(2,zzL);
   SetIndexEmptyValue(0,0.0);
   SetIndexEmptyValue(1,0.0);
   SetIndexEmptyValue(2,0.0);

//---- indicator short name
   IndicatorShortName("DT_ZZ("+ExtDepth+")");
//---- initialization done
   return(0);
  }
//+------------------------------------------------------------------+
//|                                                                  |
//+------------------------------------------------------------------+
int start()
  {
   int    i,shift,pos,lasthighpos,lastlowpos,curhighpos,curlowpos;
   double curlow,curhigh,lasthigh,lastlow;
   double min, max;
   ArrayInitialize(zz,0.0);
   ArrayInitialize(zzL,0.0);
   ArrayInitialize(zzH,0.0);

   lasthighpos=Bars; lastlowpos=Bars;
   lastlow=Low[Bars];lasthigh=High[Bars];
  for(shift=Bars-ExtDepth; shift>=0; shift--)
    {
      curlowpos=Lowest(NULL,0,MODE_LOW,ExtDepth,shift);
      curlow=Low[curlowpos];
      curhighpos=Highest(NULL,0,MODE_HIGH,ExtDepth,shift);
      curhigh=High[curhighpos];
      //------------------------------------------------
      if( curlow>=lastlow ) { lastlow=curlow; }
      else
         {
            //èäåì âíèç
            if( lasthighpos>curlowpos  )
            {
            zzL[curlowpos]=curlow;
              ///*
              min=5000; pos=lasthighpos;
               for(i=lasthighpos; i>=curlowpos; i--)
                  {
                    if (zzL[i]==0.0) continue;
                    if (zzL[i]<min) { min=zzL[i]; pos=i; }
                    zz[i]=0.0;
                  }
               zz[pos]=min;
               //*/
            }
          lastlowpos=curlowpos;
          lastlow=curlow;
         }
      //--- high
      if( curhigh<=lasthigh )  { lasthigh=curhigh;}
      else
         {
            // èäåì ââåðõ
            if( lastlowpos>curhighpos )
            {
            zzH[curhighpos]=curhigh;
           ///*
               max=-100000; pos=lastlowpos;
               for(i=lastlowpos; i>=curhighpos; i--)
                  {
                    if (zzH[i]==0.0) continue;
                    if (zzH[i]>max) { max=zzH[i]; pos=i; }
                    zz[i]=0.0;
                  }
               zz[pos]=max;
           //*/
            }
         lasthighpos=curhighpos;
         lasthigh=curhigh;
         }
    //----------------------------------------------------------------------
    }
 return(0);
}
//+------------------------------------------------------------------+
Comments