DT_ZZ_v2
Download script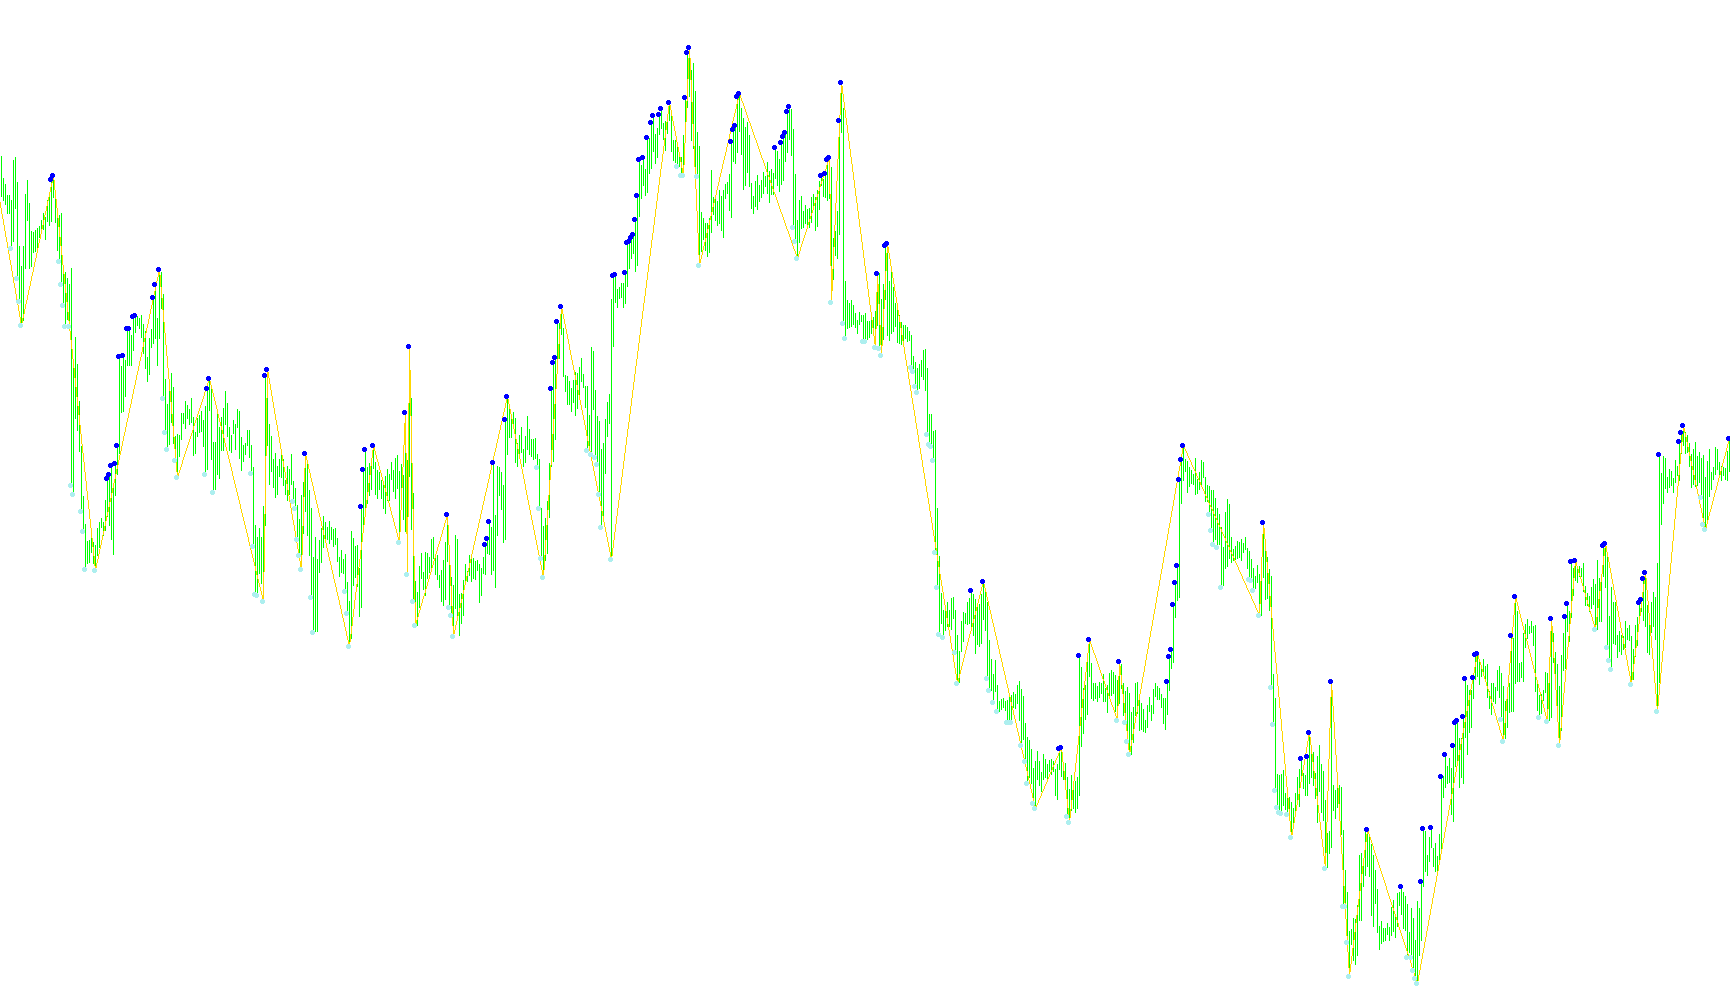
This tool is designed to analyze price action by identifying significant structural movements in a market trend. Rather than simply looking at every minor price fluctuation, the logic focuses on "swings"—the specific peaks and valleys that define the overall flow of the market.
Core Logic Overview
The script scans historical price data over a user-defined period (depth) to distinguish between noise and meaningful structural changes. It identifies two primary components:
- Higher Highs and Lower Lows: These represent the expansion of a trend.
- Lower Highs and Higher Lows: These represent the contraction or potential reversal of a trend.
How it Works
The script processes data by tracking the most recent significant highs and lows. It follows a specific logical flow to determine how to visualize these movements:
- Peak and Valley Detection: The tool constantly monitors the highest and lowest prices reached within a specific timeframe. When the price moves into new territory—creating either a higher high or a lower low—the script notes these coordinates.
- Trend Verification: It compares current price actions against previous "extreme" points. If a new peak is formed that is higher than the previous one, it marks this as part of a continuing upward momentum. Conversely, if a new low is reached that is lower than the previous one, it identifies downward momentum.
- Structural Mapping: When a significant turn occurs (for example, when a price drops to form a new low), the script looks backward to identify the preceding high point. It connects these points to visualize the "wave" of the market.
- Dynamic Filtering: The logic includes a verification step to ensure that only valid structural turns are highlighted. It evaluates the sequence of highs and lows to filter out minor retracements, ensuring that the resulting visual markers represent the primary "skeleton" of the price movement.
Visual Output
The result of this logic is a series of markings on your chart that highlight key turning points:
- High Points: Identified when the market reaches a peak before retreating.
- Low Points: Identified when the market hits a valley before rebounding.
- Trend Visualization: By highlighting these specific peaks and valleys, the tool allows you to see the overall "wave" structure of the market clearly, making it easier to identify the prevailing trend and potential areas where the price might react or reverse.
Miscellaneous
18
Views
0
Downloads
0
Favorites
DT_ZZ_v2
//+------------------------------------------------------------------+
//|                                                        DT_ZZ.mq4 |
//+------------------------------------------------------------------+
#property copyright "Copyright © 2006, klot."
#property link      "klot@mail.ru"

#property indicator_chart_window
#property indicator_buffers 3
#property indicator_color1 Aqua
#property indicator_color2 Blue
#property indicator_color3 Red
//---- indicator parameters
extern int ExtDepth=12;
//---- indicator buffers
double zzL[];
double zzH[];
double zz[];

//+------------------------------------------------------------------+
//| Custom indicator initialization function                         |
//+------------------------------------------------------------------+
int init()
  {
 //  IndicatorBuffers(3);
//---- drawing settings
   SetIndexStyle(2,DRAW_ARROW);
   SetIndexStyle(1,DRAW_ARROW);
   SetIndexStyle(0,DRAW_SECTION);
   SetIndexArrow(2,159);
   SetIndexArrow(1,159);
//---- indicator buffers mapping
   SetIndexBuffer(0,zz);
   SetIndexBuffer(1,zzH);
   SetIndexBuffer(2,zzL);
   SetIndexEmptyValue(0,0.0);
   SetIndexEmptyValue(1,0.0);
   SetIndexEmptyValue(2,0.0);

//---- indicator short name
   IndicatorShortName("DT_ZZ("+ExtDepth+")");
//---- initialization done
   return(0);
  }
//+------------------------------------------------------------------+
//|                                                                  |
//+------------------------------------------------------------------+
int start()
  {
   int    i,shift,pos,lasthighpos,lastlowpos,curhighpos,curlowpos;
   double curlow,curhigh,lasthigh,lastlow,waveH,waveL;
   double min, max;
   ArrayInitialize(zz,0.0);
   ArrayInitialize(zzL,0.0);
   ArrayInitialize(zzH,0.0);

   lasthighpos=Bars; lastlowpos=Bars;
   lastlow=Low[Bars];lasthigh=High[Bars];
  for(shift=Bars-ExtDepth; shift>=0; shift--)
    {
      curlowpos=Lowest(NULL,0,MODE_LOW,ExtDepth,shift);
      curlow=Low[curlowpos];
      curhighpos=Highest(NULL,0,MODE_HIGH,ExtDepth,shift);
      curhigh=High[curhighpos];
      //------------------------------------------------
      if( curlow>=lastlow ) { lastlow=curlow; }
      else
         {
            //èäåì âíèç
            if( lasthighpos>curlowpos  )
            {
            zzL[curlowpos]=curlow;
              ///*
              min=100000; pos=lasthighpos;
               for(i=lasthighpos; i>=curlowpos; i--)
                  {
                    if (zzL[i]==0.0) continue;
                    if (zzL[i]<min) { min=zzL[i]; pos=i; }
                    zz[i]=0.0;
                  }
               zz[pos]=min;
               //*/
            }
          lastlowpos=curlowpos;
          lastlow=curlow;
         }
      //--- high
      if( curhigh<=lasthigh )  { lasthigh=curhigh;}
      else
         {
            // èäåì ââåðõ
            if( lastlowpos>curhighpos )
            {
            zzH[curhighpos]=curhigh;
           ///*
               max=-100000; pos=lastlowpos;
               for(i=lastlowpos; i>=curhighpos; i--)
                  {
                    if (zzH[i]==0.0) continue;
                    if (zzH[i]>max) { max=zzH[i]; pos=i; }
                    zz[i]=0.0;
                  }
               zz[pos]=max;
           //*/
            }
         lasthighpos=curhighpos;
         lasthigh=curhigh;
         }
    //----------------------------------------------------------------------
    }
 return(0);
}
//+------------------------------------------------------------------+
Comments