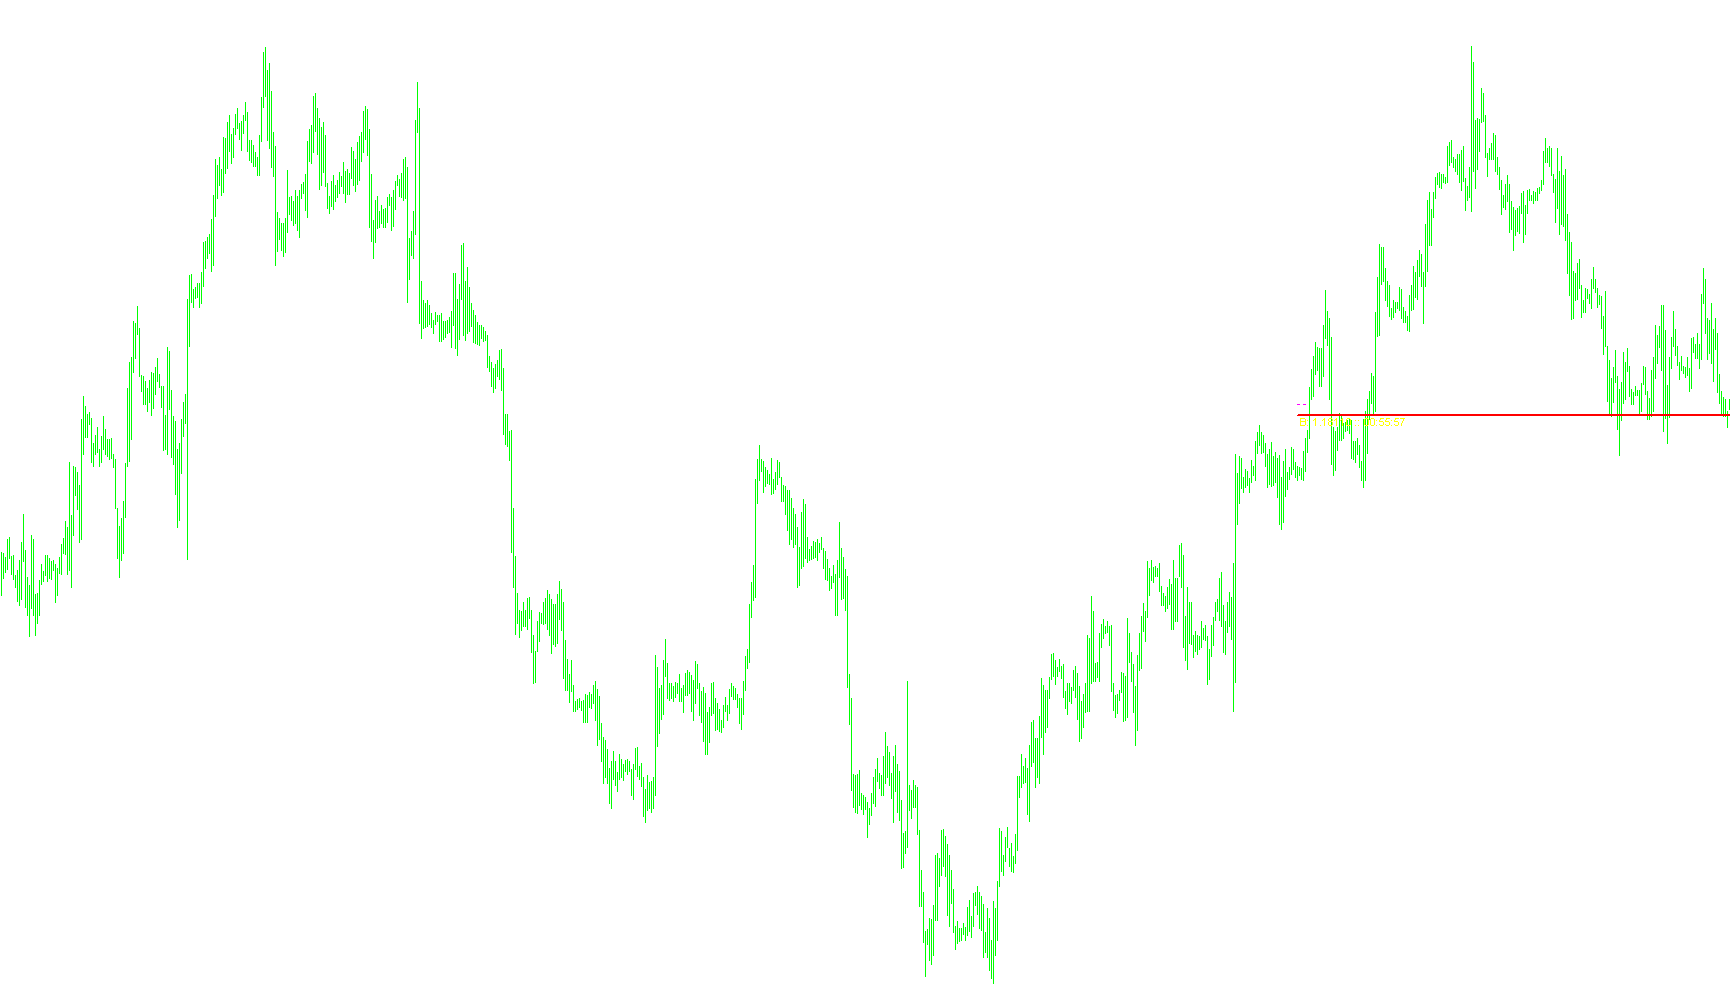
This script is designed to provide traders with a real-time visual aid on their trading charts by highlighting current market prices and tracking price movements. It focuses on providing clear, immediate information about the Bid and Ask prices without cluttering the screen with unnecessary data.
Visual Indicators and Behavior
The primary function of this tool is to draw horizontal lines on your chart that represent the active Bid (the price you sell at) and Ask (the price you buy at). These lines are dynamic, meaning they move instantly as the market fluctuates.
- Bid Line Tracking: The script highlights the Bid price with a solid line. It features an intelligent color-coding system: if the current price moves upward compared to the previous tick, the line changes to a specific "Up" color (default is Lime Green); if it moves downward, it switches to a "Down" color (default is Red).
- Ask Line Tracking: The Ask price is displayed as a dotted line. This provides a secondary visual reference so you can easily see the "spread"—the gap between what you can buy and sell for at any given moment.
- Dynamic Text Labels: On lower timeframes (like Hourly or Minute charts), the script can automatically display text on the screen. This text shows the exact price and the specific time remaining until the current candle closes, helping you keep track of upcoming market transitions.
Technical Logic and User Experience
The logic behind the script ensures that the visual elements remain clean and organized regardless of how fast the market is moving:
- Real-Time Updates: The script runs on a high-frequency timer (every second) to ensure that the lines and text updates are smooth and synchronized with live market action.
- Automatic Cleanup: One of the key features of this logic is its "self-cleaning" nature. It identifies and removes old, outdated text and line objects as they become obsolete, preventing your chart from becoming cluttered with "ghost" lines or overlapping text.
- Smart Scaling: The script calculates the length and position of the visual lines based on your current window width. This ensures that the indicator looks proportional and professional whether you are looking at a large monitor or a smaller window.
- Precision Handling: The script includes specific logic to handle different types of currency pairs. It detects how many decimal places a currency has and rounds its calculations accordingly, ensuring that the price labels remain accurate for everything from major pairs to exotic ones.
Customization Options
Users can easily tailor the visual experience through several settings:
- Visibility: You can choose whether to show the Ask line or the on-screen text labels independently.
- Aesthetics: You can customize colors (for both the Ask and Bid lines) and adjust the thickness of the lines to match your personal trading style.
- Scaling: You can adjust how much of the screen width the price lines occupy, allowing for a more compact or more expansive view of the market data.
13
Views
0
Downloads
0
Favorites
dynamic_candle_timer
//+------------------------------------------------------------------+
//|                                         Dynamic Candle Timer.mq4 |
//|                                        Copyright 2014, J Trayder |
//|                                         ready for MT4 build 600+ |
//+------------------------------------------------------------------+
#property copyright "Copyright 2014, J Trayder"
#property link      ""
#property version   "1.20"
#property indicator_chart_window
// ***************************************************************************
// ***************************************************************************
//  LICENSING:  This is free, open source software, licensed under
//              Version 2 of the GNU General Public License (GPL).
//
//  In particular, this means that distribution of this software in a binary
//  format, e.g. as compiled as part of a .ex4 format, must be accompanied
//  by the non-obfuscated source code of both this file, AND the .mt4 source
//  files from which it is compiled, or you must make such files available at
//  no charge to binary recipients.	If you do not agree with such terms you
//  must not use this code.  Detailed terms of the GPL are widely available
//  on the Internet.  The Library GPL (LGPL) was intentionally not used,
//  therefore the source code of files which link to this are subject to
//  terms of the GPL if binaries made from them are publicly distributed or
//  sold.
//
//  ANY USE OF THIS CODE NOT CONFORMING TO THIS LICENSE MUST FIRST RECEIVE
//  PRIOR AUTHORIZATION FROM THE AUTHOR(S).  ANY COMMERCIAL USE MUST FIRST
//  OBTAIN A COMMERCIAL LICENSE FROM THE AUTHOR(S).
//
// ***************************************************************************
// ***************************************************************************


#define Refresh_MilliSeconds     1000
enum    YN {No,Yes};

input int        bidLineWeight               = 2;           //thickness BID line:
input color      askColor                    = clrMagenta;  //color ASK line:
input YN         showAsk                     = Yes;         //show ASK?
input YN         showText                    = Yes;         //show price & time text?
input int        widthFactor                 = 4;           //proportion of line length to window width
input color      TextColor                   = clrYellow;   //color of the text:
input color      line_UP_color               = clrLimeGreen; //color of UP BID line:
input color      line_DN_color               = clrRed;       //color of DN BID line:

double            last_lineB=0,last_lineA=0,myPoint=0,New_Price,Old_Price;
datetime          T1,T4;
int               Chart_Scale=0;
color             Static_Price_Color,Static_Bid_Color,BidLineColor,Static_BidLineColor,
                  _UP_color,_DN_color;
//+------------------------------------------------------------------+
//| Custom indicator initialization function                         |
//+------------------------------------------------------------------+
int OnInit()
  {
   EventSetMillisecondTimer(Refresh_MilliSeconds);
   myPoint=SetPoint(Symbol());

   placeLineB(Bid);
   placeLineA(Ask);

   Chart_Scale=ChartScaleGet();
   ChartShowGridSet(true,0);

   return(INIT_SUCCEEDED);
  }
//+------------------------------------------------------------------+
//| Custom indicator deinitialization function                       |
//+------------------------------------------------------------------+
void OnDeinit(const int reason)
  {
   del_obj("last_bid",0);
   del_obj("last_ask",0);
   del_obj("txt1_",0);
   del_obj("txt2_",0);
   return;
  }
//+------------------------------------------------------------------+
//| Custom indicator iteration function                              |
//+------------------------------------------------------------------+
int OnCalculate(const int rates_total,
                const int prev_calculated,
                const datetime &time[],
                const double &open[],
                const double &high[],
                const double &low[],
                const double &close[],
                const long &tick_volume[],
                const long &volume[],
                const int &spread[])

  {

   _UP_color = line_UP_color;
   _DN_color = line_DN_color;

   if(Digits>2)
     {
      New_Price=MathFloor(Bid/myPoint)*myPoint;
     }
   else
     {
      New_Price=Bid;
     }
   if(New_Price>Old_Price)
     {
      BidLineColor=_UP_color;
      Static_BidLineColor=BidLineColor;
     }
   else
     {
      if(New_Price<Old_Price)
        {
         BidLineColor=_DN_color;
         Static_BidLineColor=BidLineColor;
        }
      else //if (New_Price == Old_Price)
        {
         BidLineColor=Static_BidLineColor;
        }
     }
   Old_Price=New_Price;

   placeLineB(Bid);
   placeLineA(Ask);

   return(rates_total);
  }
//+------------------------------------------------------------------+
//| Timer function                                                   |
//+------------------------------------------------------------------+
void OnTimer()
  {
   datetime closetime=Time[0]+PeriodSeconds()-TimeCurrent();
  }
//+------------------------------------------------------------------+
//| bid line                                                         |
//+------------------------------------------------------------------+
void placeLineB(double price) //bid
  {
   datetime closetime=Time[0]+PeriodSeconds()-TimeCurrent();
   int      lineLength=WindowBarsPerChart()/widthFactor;
   int      textPosition=WindowBarsPerChart()/(widthFactor/2);

   line("last_bid",Time[lineLength],price,Time[1],price,BidLineColor,bidLineWeight,STYLE_SOLID,"",false); ObjectDelete("txt1_");
   if(showText)
     {
      if(Period()<=PERIOD_D1)
        {
         ObjectCreate("txt1_",OBJ_TEXT,0,Time[lineLength],price);
         ObjectSetText("txt1_",StringConcatenate("                                     B: ",DoubleToStr(price,Digits)," :: ",TimeToStr(closetime,TIME_SECONDS)),8,"Arial",TextColor);
        }
     }
   else if(Period()>PERIOD_D1) Comment("Timeframe max: Daily");

   last_lineB=price;
   ChartRedraw();
  }
//+------------------------------------------------------------------+
//|  ask line                                                        |
//+------------------------------------------------------------------+
void placeLineA(double price) //ask
  {
   datetime closetime=Time[0]+PeriodSeconds()-TimeCurrent();
   double   spread=(Ask-Bid);
   int      lineLength=WindowBarsPerChart()/widthFactor;

   if(showAsk) { line("last_ask",Time[lineLength],price,Time[lineLength-6],price,askColor,1,STYLE_DOT,"",false); }
   last_lineA=price;
   ChartRedraw();
  }
//+------------------------------------------------------------------+
//|  get last bid value                                              |
//+------------------------------------------------------------------+
double getLineB()
  {
   return(ObjectGet("last_bid", OBJPROP_PRICE1));
  }
//+------------------------------------------------------------------+
//| get last ask value                                               |
//+------------------------------------------------------------------+
double getLineA()
  {
   return(ObjectGet("last_ask", OBJPROP_PRICE1));
  }
//+------------------------------------------------------------------+
//|  move bid line                                                   |
//+------------------------------------------------------------------+
void lineMoveB()
  {
   double lineB=getLineB();
   if(!isEqualPrice(lineB,last_lineB)) placeLineB(last_lineB); // simply replace line
   else
      if(ObjectFind(0,"last_bid")==0) placeLineB(Bid);         //place new line
   return;
  }
//+------------------------------------------------------------------+
//|  move ask line                                                   |
//+------------------------------------------------------------------+
void lineMoveA()
  {
   double lineA=getLineA();
   if(!isEqualPrice(lineA,last_lineA)) placeLineA(last_lineA); // simply replace line
   else
      if(ObjectFind(0,"last_ask")==0) placeLineA(Ask);         //place new line
   return;
  }
//+------------------------------------------------------------------+
//|                                                                  |
//+------------------------------------------------------------------+
/**
* Compare two prices.
* The floating point precision of MT4 can make two seemingly identical values
* still differ from each other. This function will compare two prices after
* rounding them to the precision that is used for prices (value of _Digits).
*/
bool isEqualPrice(double aa,double bb)
  {
   return(NormalizeDouble(aa, _Digits) == NormalizeDouble(bb, _Digits));
  }
//+------------------------------------------------------------------+
//|                                                                  |
//+------------------------------------------------------------------+
/**
* Create a line connecting 2 points.
*/
string line(string name,datetime t1,double p1,datetime t2,double p2,color clr=clrRed,int width=1,int style=STYLE_SOLID,string label="",bool ray=False)
  {
   if(!IsOptimization())
     {
      if(name=="")
        {
         name="tLine_"+Time[0];
        }
      if(ObjectFind(name)==-1)
        {
         ObjectCreate(name,OBJ_TREND,0,t1,p1,t2,p2);
        }
      ObjectSet(name,OBJPROP_RAY,ray);
      ObjectSet(name,OBJPROP_COLOR,clr);
      ObjectSet(name,OBJPROP_WIDTH,width);
      ObjectSet(name,OBJPROP_STYLE,style);
      ObjectSet(name,OBJPROP_TIME1,t1);
      ObjectSet(name,OBJPROP_TIME2,t2);
      ObjectSet(name,OBJPROP_PRICE1,p1);
      ObjectSet(name,OBJPROP_PRICE2,p2);
      ObjectSetText(name,label,7,"Arial",clr);
     }
   return(name);
  }
//+------------------------------------------------------------------+
//| del_obj function                                                 |
//+------------------------------------------------------------------+
void del_obj(string key,int StartPos=0)
  {
//+------------------------------------------------------------------+
//| del_obj(string key)                                              |
//| deletes all object with a name beginning with "key"              |
//+------------------------------------------------------------------+
   string FunctionName="del_obj";
//int starter = GetTickCount( );
   int k=0;
   while(k<ObjectsTotal())
     {
      string objname=ObjectName(k);
      if(StringSubstr(objname,StartPos,StringLen(key)-StartPos)==key)
        {
         ObjectDelete(objname);
        }
      else
        {
         k++;
        }
     }//while (k<ObjectsTotal())
   return;
  }
//+------------------------------------------------------------------+
//|                                                                  |
//+------------------------------------------------------------------+
double SetPoint(string mySymbol)
  {
   double mPoint,myDigits;

   myDigits=MarketInfo(mySymbol,MODE_DIGITS);
   if(myDigits<4)
      mPoint=0.01;
   else
      mPoint=0.0001;

   return(mPoint);
  }
//+------------------------------------------------------------------+
//| The function enables/disables the chart grid.                    |
//+------------------------------------------------------------------+
bool ChartShowGridSet(const bool value,const long chart_ID=0)
  {
//--- reset the error value
   ResetLastError();
//--- set the property value
   if(!ChartSetInteger(chart_ID,CHART_SHOW_GRID,0,value))
     {
      //--- display the error message in Experts journal
      Print(__FUNCTION__+", Error Code = ",GetLastError());
      return(false);
     }
//--- successful execution
   return(true);
  }
//+------------------------------------------------------------------+
//| Subroutine:  Get the chart scale number                          |
//+------------------------------------------------------------------+
int ChartScaleGet()
  {
   long result=-1;
   ChartGetInteger(0,CHART_SCALE,0,result);
   return((int)result);
  }

//~~~~~~~~~~~~~~~~~~~~~~~~~~~~~~~~~~end~~~~~~~~~~~~~~~~~~~~~~~~~~~~~~~end~~~~~~~~~~~~~~~~~~~~~~~~~~~
Comments