Dynamic_Zone_RSI2
Download script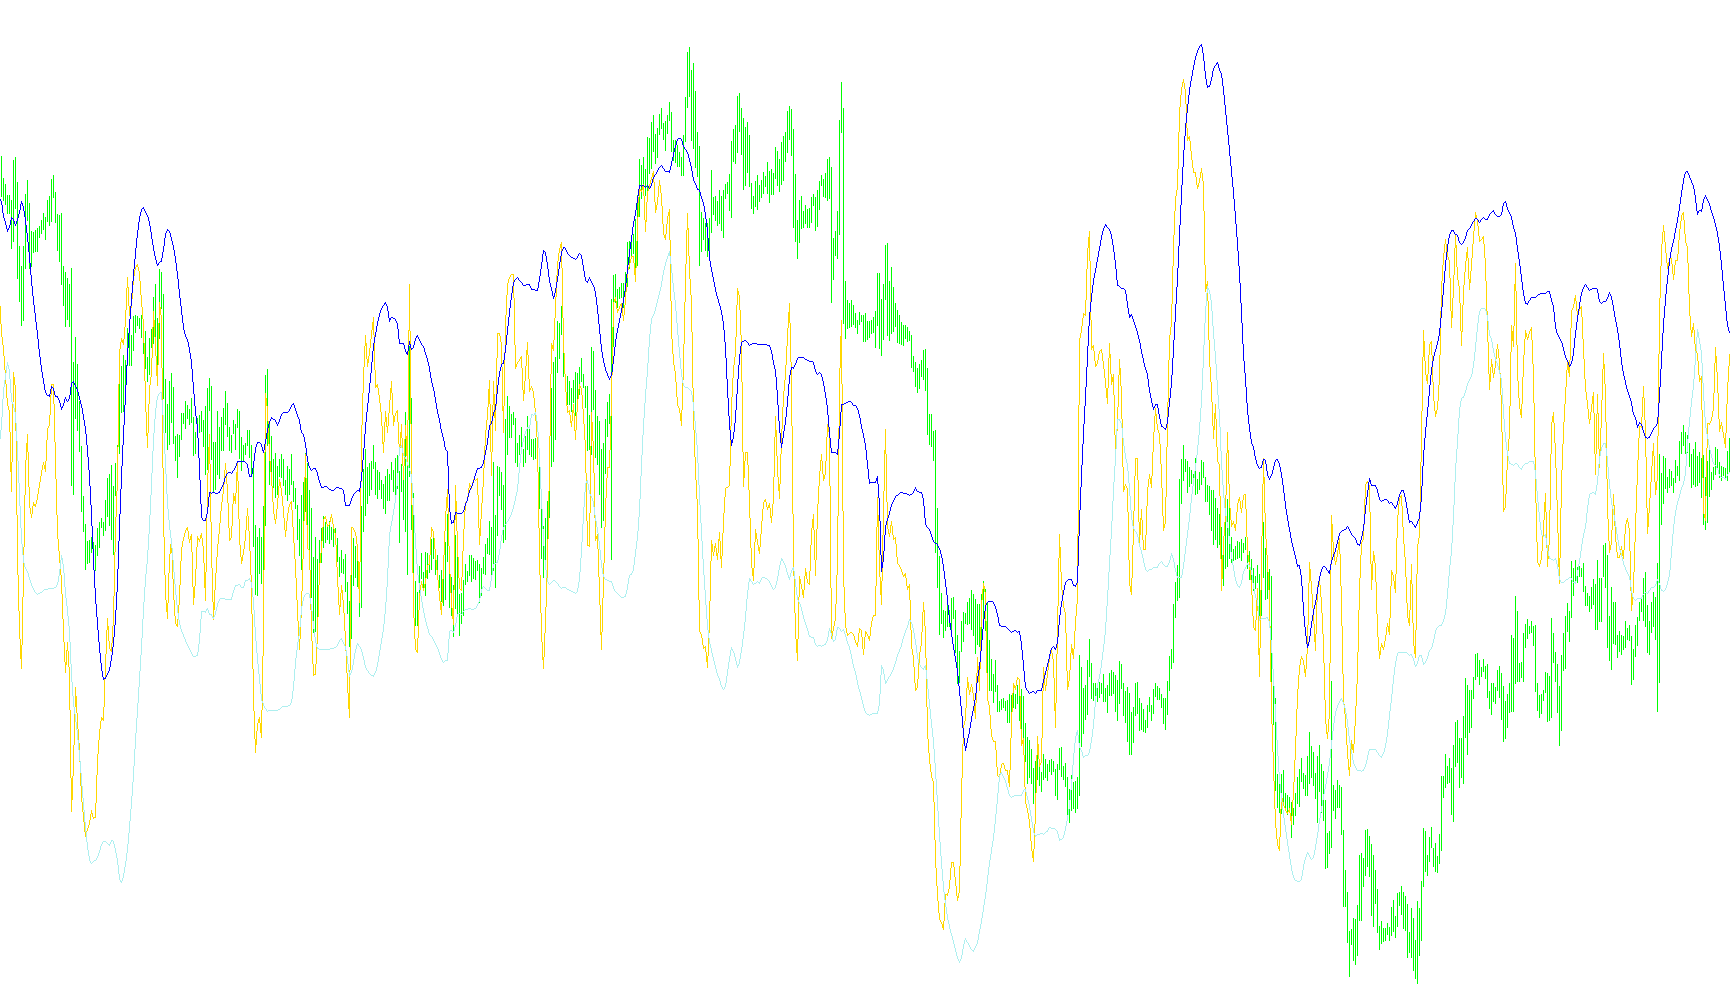
This script, titled Dynamic Zone RSI, is a technical analysis tool designed to provide traders with a visual representation of market momentum while accounting for volatility. Unlike a standard Relative Strength Index (RSI) which only shows the strength of price movements, this indicator creates "dynamic zones" that adapt to the current state of the market.
Core Logic and Functionality
1. Momentum Tracking (The RSI Base) At its foundation, the script calculates a standard RSI. This measures how quickly and significantly the price is moving in one direction compared to the other. It acts as the primary "heartbeat" of the indicator, showing whether an asset is potentially overbought or oversold.
2. Moving Average Smoothing To prevent the data from being too erratic or "noisy," the script takes the RSI values and applies a moving average. This smooths out minor price fluctuations, allowing the user to see the broader trend of the momentum rather than reacting to every small tick in the market.
3. Dynamic Volatility Zones This is the most unique feature of the script. It calculates the "Standard Deviation"—a mathematical measure of how much the data typically varies from its average. By using this calculation, the script builds two dynamic boundary lines (Upper and Lower Zones) around the smoothed RSI:
- The Upper Zone: Represents an expansion of momentum based on current volatility.
- The Lower Zone: Represents a contraction of momentum based on current volatility.
How it Works in Practice
Instead of using fixed, static levels (like the traditional 70 or 30 levels), this indicator creates a "channel" that breathes with the market.
- When the market is calm: The zones will tighten together, showing that momentum is stable.
- When the market becomes volatile: The zones will expand outward automatically.
By providing these dynamic boundaries, the tool helps traders identify when the current momentum is reaching an extreme relative to recent history. It essentially tells the user not just "where" the price is, but how "extreme" the current movement is compared to the typical behavior of the asset during that specific time period.
//+------------------------------------------------------------------+
//|                                             Dynamic Zone RSI.mq4 |
//|                                   Copyright © 2005, Pavel Kulko. |
//|                                                  polk@alba.dp.ua |
//+------------------------------------------------------------------+
#property copyright "Copyright © 2005, Pavel Kulko"
#property link      "polk@alba.dp.ua"
#property indicator_buffers 3
#property indicator_color1 Lime
#property indicator_color2 SlateBlue
#property indicator_color3 Orange
#property indicator_separate_window
//----
extern int RSIPeriod=14;
extern int BandPeriod=20;
//----
double RSIBuf[],UpZone[],DnZone[];
//+------------------------------------------------------------------+
//| Custom indicator initialization function                         |
//+------------------------------------------------------------------+
int init()
  {
//---- indicators
   SetIndexStyle(0,DRAW_LINE);
   SetIndexStyle(1,DRAW_LINE);
   SetIndexStyle(2,DRAW_LINE);
   SetIndexBuffer(0,RSIBuf);
   SetIndexBuffer(1,UpZone);
   SetIndexBuffer(2,DnZone);
//----
   return(0);
  }
//+------------------------------------------------------------------+
//| Custor indicator deinitialization function                       |
//+------------------------------------------------------------------+
int deinit()
  {
//----
//----
   return(0);
  }
//+------------------------------------------------------------------+
//| Custom indicator iteration function                              |
//+------------------------------------------------------------------+
int start()
  {
   double MA, RSI[];
   ArrayResize(RSI,BandPeriod);
   int counted_bars=IndicatorCounted();
   int limit=Bars-counted_bars-1;
   for(int i=limit; i>=0; i--)
     {
      RSIBuf[i]=iRSI(NULL,0,RSIPeriod,PRICE_WEIGHTED,i);
      MA=0;
        for(int j=i; j<i+BandPeriod; j++)
        {
         RSI[j-i]=RSIBuf[j];
         MA+=RSIBuf[j]/BandPeriod;
        }
      UpZone[i]=MA + (1.3185 * StDev(RSI,BandPeriod));
      DnZone[i]=MA - (1.3185 * StDev(RSI,BandPeriod));
     }
//----
   return(0);
  }
//+------------------------------------------------------------------+
//|                                                                  |
//+------------------------------------------------------------------+
double StDev(double& Data[], int Per)
  {
   return(MathSqrt(Variance(Data,Per)));
  }
//+------------------------------------------------------------------+
//|                                                                  |
//+------------------------------------------------------------------+
double Variance(double& Data[], int Per)
  {
   double sum, ssum;
   for(int i=0; i<Per; i++)
     {
      sum+=Data[i];
      ssum+=MathPow(Data[i],2);
     }
   return((ssum*Per - sum*sum)/(Per*(Per-1)));
  }
//+------------------------------------------------------------------+
Comments