DynamicRS_3CLines
Download script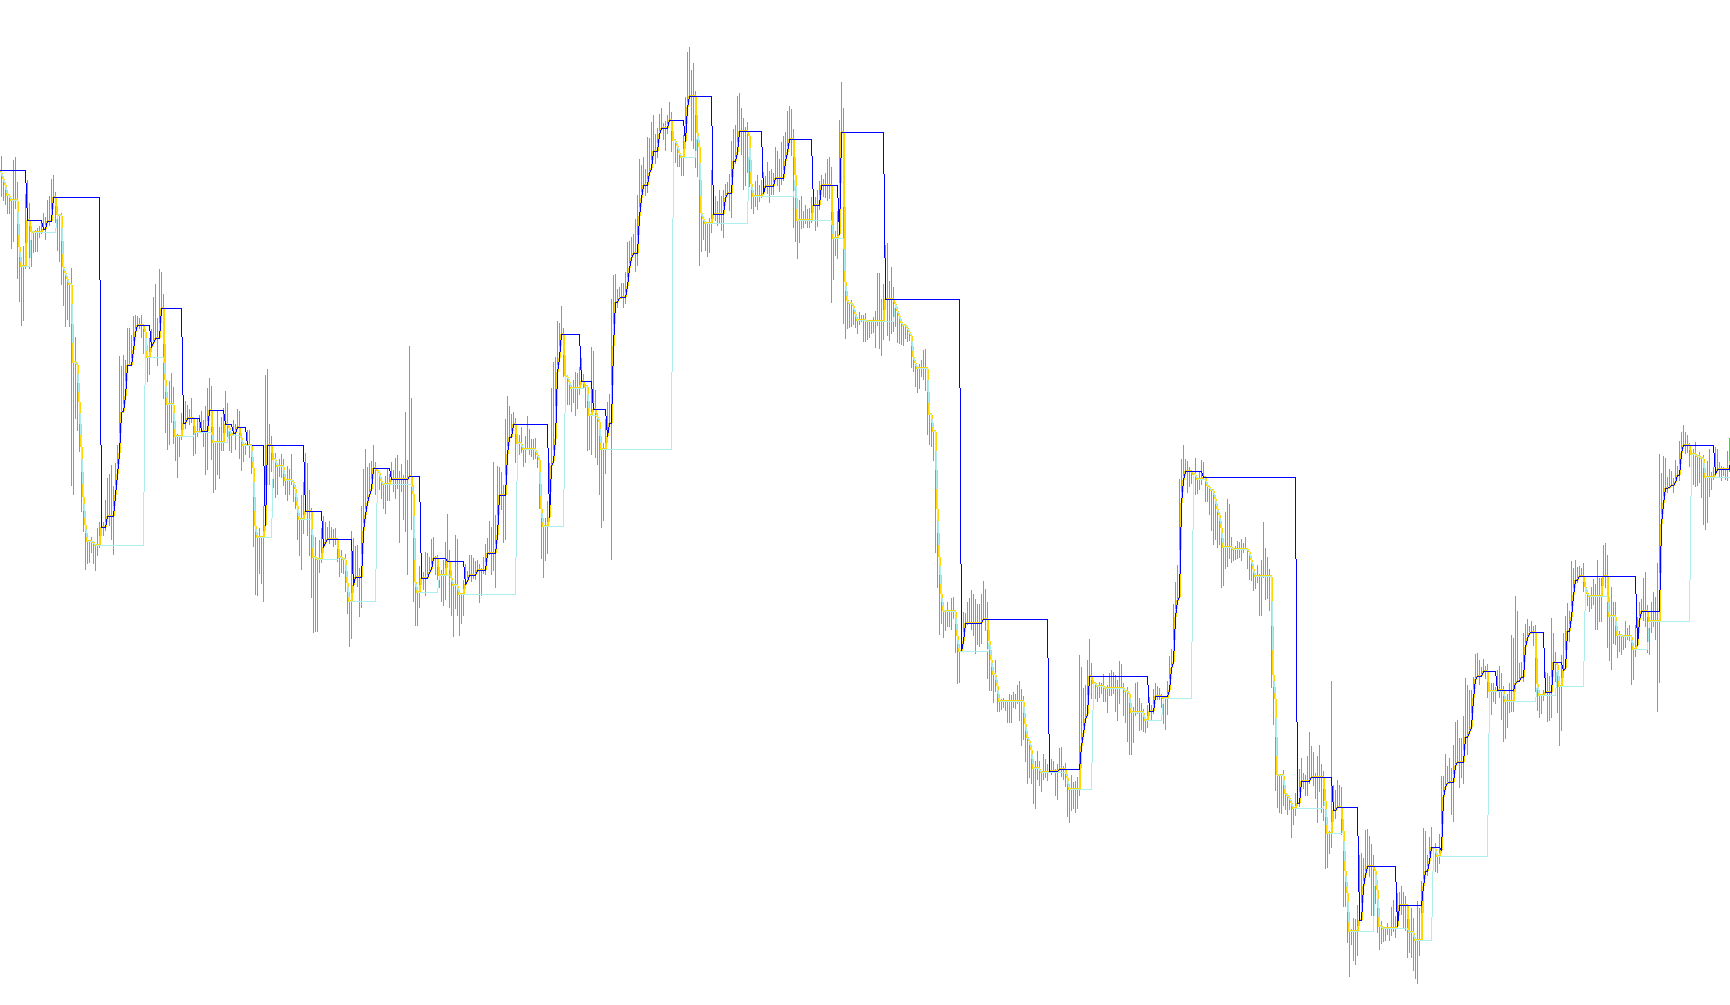
The DynamicRS_3CLines script is a visual trading tool designed to track and highlight significant price boundaries on a chart. Rather than using static levels, it dynamically adjusts based on the market's movement, identifying key "turning points" where the price establishes new extremes.
How the Logic Works
The script monitors the highest and lowest prices reached during each candle's movement. It works by comparing the current price action against the previous boundaries to determine if a new level of significance has been reached. Here is the breakdown of its behavior:
-
Identifying Lower Boundaries: When the market makes a lower high (the current peak is lower than the previous one) and that peak falls below the existing established boundary, the script recognizes this as a potential shift in trend. It then updates the primary tracking line to this new lower level.
-
Identifying Upper Boundaries: Conversely, if the market produces a higher low (the current valley is higher than the previous one) and that valley rises above the existing boundary, the script identifies this as an upward shift. It automatically adjusts the tracking line to capture this new higher floor.
-
Maintaining Stability: In moments where the price remains within the established range—meaning it isn't breaking out in a way that meets the specific "higher low" or "lower high" criteria—the script holds its current position. It preserves the existing levels to ensure the visual lines remain steady and do not flicker with minor market noise.
Visual Representation
The tool produces three distinct lines on your chart:
- Primary Tracking Line: This is the main dynamic boundary that moves in response to the market's structural shifts.
- Top/Upper Boundary: This captures the upper limits of the identified range.
- Bottom/Lower Boundary: This captures the lower limits of the identified range.
By reacting only to specific structural changes in price, this script helps traders visualize the "breathing room" of the market, highlighting whether the current price action is expanding into new territory or consolidating within a defined zone.
//+------------------------------------------------------------------+
//|                                            DynamicRS_3CLines.mq4 |
//|                                 Copyright © 2007, Nick A. Zhilin |
//|                                                  rebus58@mail.ru |
//+------------------------------------------------------------------+

#property copyright "Copyright © 2007, Nick A. Zhilin"
#property link      "rebus58@mail.ru"

#property indicator_chart_window
#property indicator_buffers 3
#property indicator_color1 Yellow
#property indicator_color2 Aqua
#property indicator_color3 Red

//---- buffers
double ExtMapBuffer1[];
double TopLine[];
double BottomnLine[];

//+------------------------------------------------------------------+
//| Custom indicator initialization function                         |
//+------------------------------------------------------------------+
int init()
  {
   IndicatorShortName("DynamicRS_3CLines");
//---- indicators
   SetIndexStyle(0,DRAW_LINE,STYLE_SOLID,2);
   SetIndexBuffer(0,ExtMapBuffer1);
   SetIndexStyle(1,DRAW_LINE);
   SetIndexBuffer(1,TopLine);
   SetIndexStyle(2,DRAW_LINE);
   SetIndexBuffer(2,BottomnLine);

//----
   return(0);
  }
//+------------------------------------------------------------------+
//| DynamicRS                                                        |
//+------------------------------------------------------------------+
int start()
  {
   int i,counted_bars=IndicatorCounted();

//----
   i=Bars-counted_bars-1;
   while(i>=0)
     {
      if(High[i]<High[i+1] && High[i]<ExtMapBuffer1[i+1])
         {
          ExtMapBuffer1[i]=High[i];
          BottomnLine[i]=High[i];
          TopLine[i]=TopLine[i+1];
         }
      else if(Low[i]>Low[i+1] && Low[i]>ExtMapBuffer1[i+1])
         {
          ExtMapBuffer1[i]=Low[i];
          TopLine[i]=Low[i];
          BottomnLine[i]=BottomnLine[i+1];
         }
      else
         {
          ExtMapBuffer1[i]=ExtMapBuffer1[i+1];
          if(ExtMapBuffer1[i+1]==TopLine[i+1])
             {
              TopLine[i]=ExtMapBuffer1[i+1];
              BottomnLine[i]=BottomnLine[i+1];
             }
          else if(ExtMapBuffer1[i+1]==BottomnLine[i+1])
             {
              BottomnLine[i]=ExtMapBuffer1[i+1];
              TopLine[i]=TopLine[i+1];
             }
         }
      i--;
     }


//----
   return(0);
  }
//+------------------------------------------------------------------+
Comments