Extrapolator - sincMA
Download script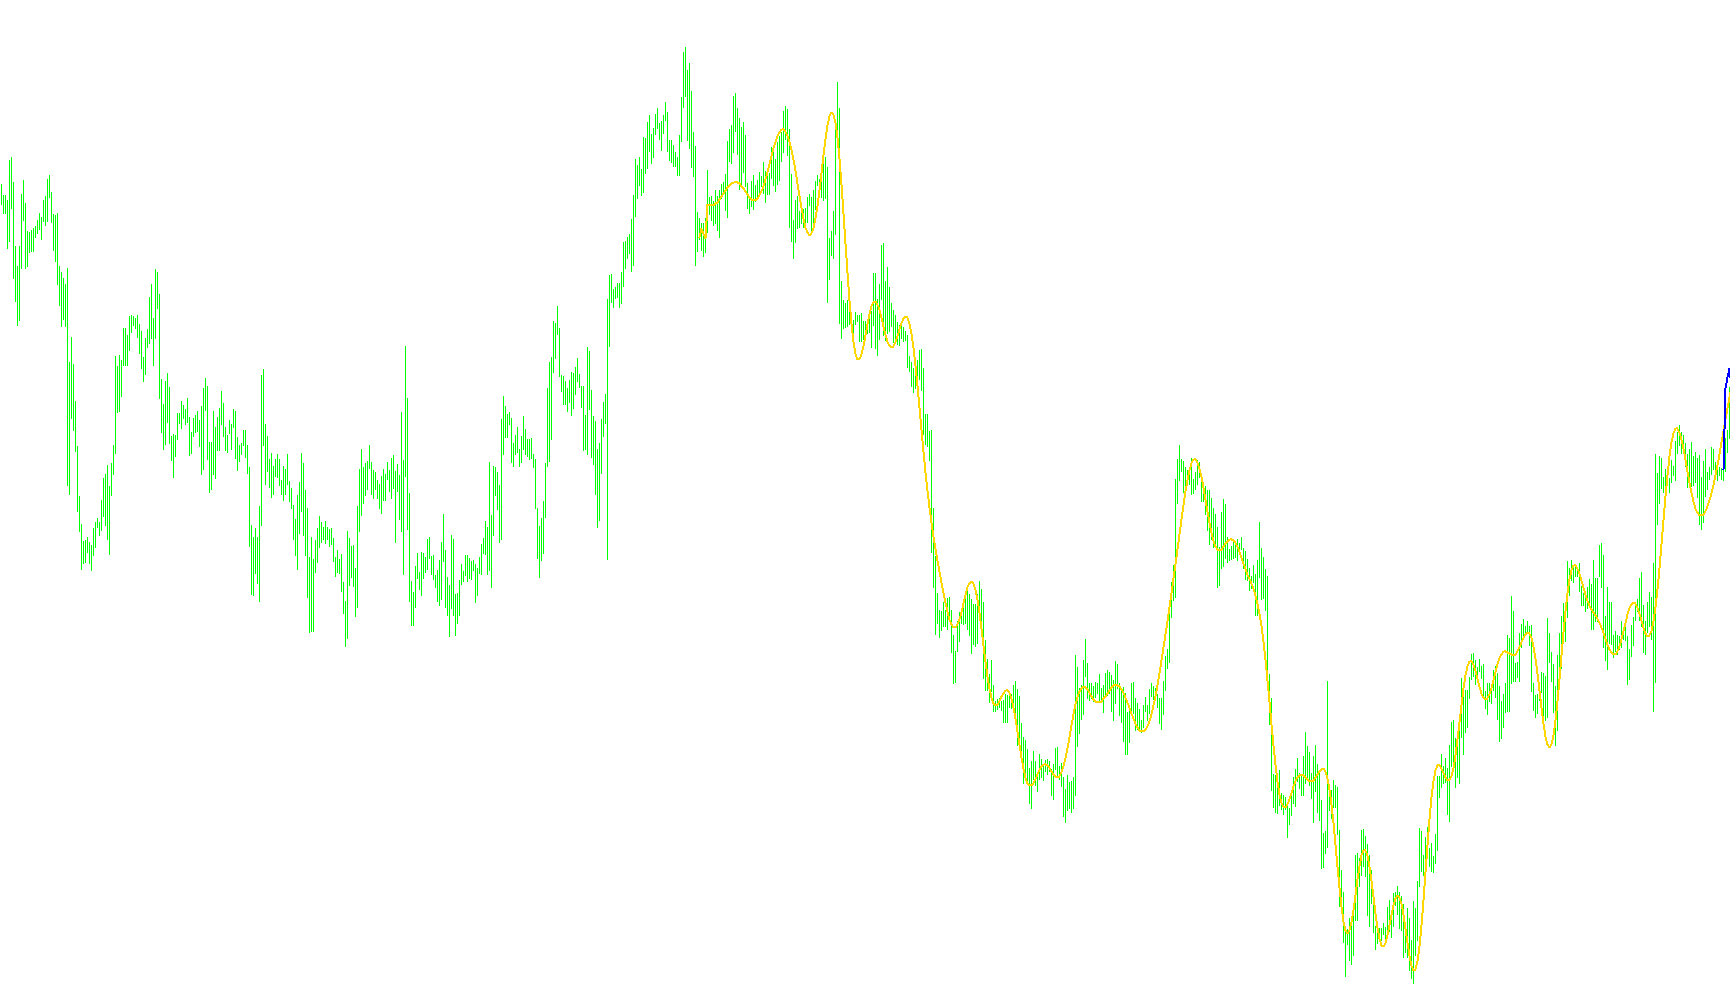
The Extrapolator - sincMA is a specialized technical analysis tool designed to analyze historical price trends and project potential future movements based on mathematical patterns. Unlike standard moving averages that simply smooth out past data, this script uses advanced signal processing logic to "fit" a mathematical wave to the existing price action.
How the Logic Works
The tool operates through three primary logical phases:
1. Data Sampling and Preparation The script begins by examining a specific window of historical market data (defined by the user as past bars). It identifies the core price movements within this timeframe and establishes a baseline. This creates a foundation from which the algorithm can begin to calculate the "shape" of the current trend.
2. Wavelet Fitting (The "Sinc" Function) The core engine of this script is the "sinc" function. In signal processing, this is used to reconstruct signals with minimal distortion. The script takes the historical price points and applies a series of mathematical pulses to them.
- It calculates the difference between actual market prices and the current trend line.
- It then applies a "wavelet" adjustment to these differences.
- By repeating this process multiple times (the damping factor), the tool refines its shape until it matches the organic flow of the market data as closely as possible.
3. Trend Projection (Extrapolation) Once the script has successfully mapped the mathematical curve to the past data, it extends that logic forward into "imaginary" space. This is where the extrapolation occurs:
- The tool treats the momentum and curvature discovered in the historical data as a blueprint.
- It projects this curve into the future, creating a visual representation of where the price might travel based on its current trajectory.
Key Visual Outputs
The script provides two distinct visual components on your chart:
- Past Data Vector: A line that follows the historical price, showing how the algorithm has interpreted the market's recent movement.
- Future Data Vector: A projected line that extends beyond the current price point, offering a visual estimation of the trend's path ahead.
Summary for the User
In essence, this tool doesn't just tell you where the price was; it attempts to understand the "frequency" and "rhythm" of the market's movement. By fitting a sophisticated mathematical wave to that rhythm, it provides a visual forecast of the likely path the price will take in the immediate future.
//+------------------------------------------------------------------+
//|                                        Extrapolator - sincMA.mq4 |
//|                                          Copyright © 2009, gpwr. |
//+------------------------------------------------------------------+
#property copyright "Copyright © 2009, gpwr."
#property indicator_chart_window
#property indicator_buffers 2
#property indicator_color1 Blue
#property indicator_color2 Red
#property indicator_width1 2
#property indicator_width2 2

//Global constants
#define pi 3.141592653589793238462643383279502884197169399375105820974944592

//Input parameters
extern int    LastBar  =0;   //Last bar in the past data
extern int    PastBars =512; //Number of past bars. 0: all data.
extern int    FutBars  =30;  //Number of predicted future bars. Must be less than PastBars
extern int    trun     =3;   //Number of the last wavelets to truncate.
extern double Q        =1.0; //Damping factor. Higher Q gives more ripple. Q=1 gives sinc function.

//Global variables
int n,nf,lb,pwrMax;

//Indicator buffers
double pv[],fv[];

//Initialize---------------------------------------------------------+
int init()
  {
   // Initialize number of fitted values and the max number of sinc pulses
   lb=LastBar;
   nf=FutBars;
   if(PastBars<=0) PastBars=Bars-lb;
   n=1;
   int pwr=0;
   while(n<=PastBars)
   {
      pwr++;
      n*=2;
   }
   pwr--;
   n/=2;
   if(nf>n) nf=n;
   if(trun<=0) trun=0;
   if(trun>=pwr) trun=pwr;
   pwrMax=pwr-trun;

   //Initialize indicators
   IndicatorBuffers(2);
   SetIndexBuffer(0,pv);
   SetIndexBuffer(1,fv);
   SetIndexStyle(0,DRAW_LINE,STYLE_SOLID,2);
   SetIndexStyle(1,DRAW_LINE,STYLE_SOLID,2);
   SetIndexShift(0,-lb);//past data vector 0..n; 0 corresponds to bar=lb
   SetIndexShift(1,nf-lb);//future data vector i=0..nf; nf corresponds to bar=lb
   IndicatorShortName("Extrapolator - sincMA");
   return(0);
  }

int deinit(){return(0);}

//START--------------------------------------------------------------+
int start()
{
   // Initialize the indicator buffers with straight lines
   for(int i=0;i<=n;i++)
   {
      pv[i]=Close[lb]+(Close[n+lb]-Close[lb])*i/n;
      if(i<=nf) fv[i]=Close[lb]-(Close[n+lb]-Close[lb])*i/n;
   }

   // Sample the data and fit sinc pulses to it
   double dp[],df[];
   ArrayResize(dp,n+1);
   ArrayResize(df,nf+1);
   int ss=2*n; // sampling step
   for(int p=1;p<=pwrMax;p++)
   {
      ss=ss/2;
      for(i=0;i<=n;i++)
      {
         dp[i]=0.0;
         if(i<=nf) df[i]=0.0;
         for(int j=1;j<=n/ss;j++)
         {
            double dif=Close[j*ss-ss/2+lb]-pv[j*ss-ss/2];
            dp[i]+=dif*wave(2*j-1-2.0*i/ss,Q);
            if(i<=nf) df[i]+=dif*wave(2*j-1+2.0*i/ss,Q);
         }
      }
      for(i=0;i<=n;i++)
      {
         pv[i]+=dp[i];
         if(i<=nf) fv[i]+=df[i];
      }
   }

   // Reorder fv[]
   for(i=0;i<nf/2;i++)
   {
      double tmp=fv[i];
      fv[i]=fv[nf-i];
      fv[nf-i]=tmp;
   }

   return(0);
}

//sinc function------------------------------------------------------+
double wave(double x, double Q)
{
   if(x==0.0) return(1.0);
   else return(MathSin(pi*x)/(pi*x)/(x*x+1.0)*(Q*x*x+1.0));
}
//+------------------------------------------------------------------+
Comments