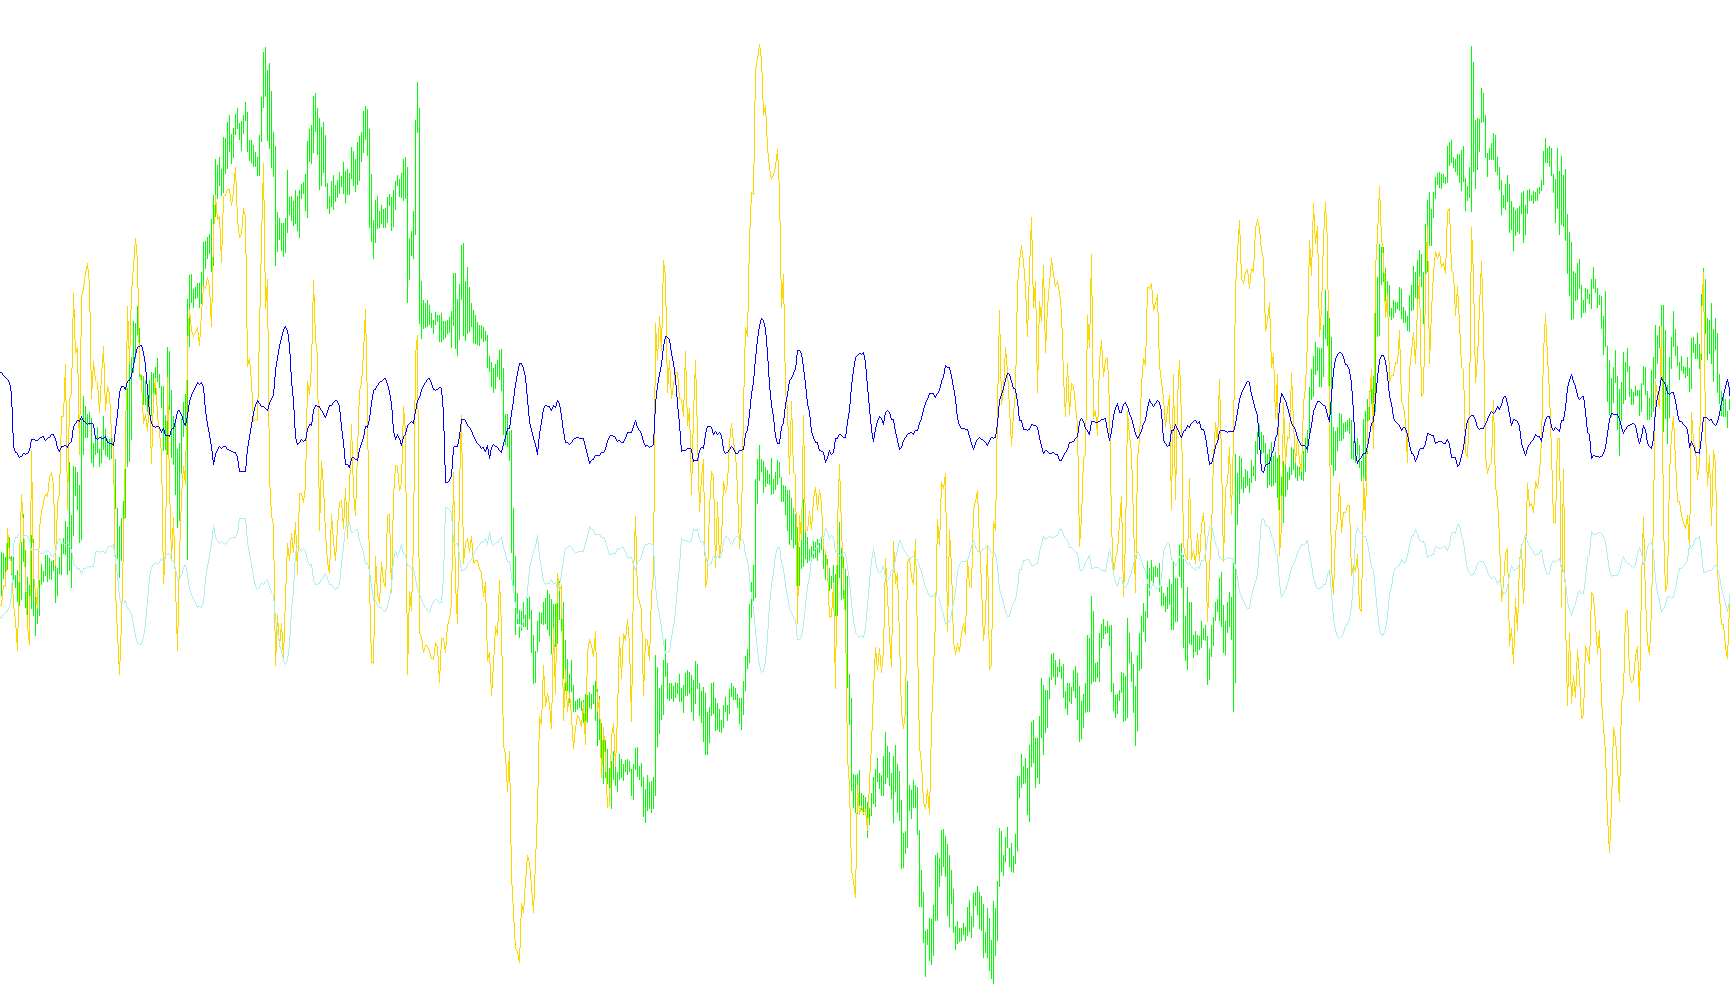
This tool is a specialized technical analysis indicator designed to measure the momentum and relative strength of a financial asset. While it builds upon the logic of the standard Relative Strength Index (RSI), it introduces specific mathematical refinements to provide more nuanced data for traders.
Core Functionality
The primary purpose of this script is to determine whether an asset's price movement is predominantly "bullish" (moving up) or "bearish" (moving down) over a specific timeframe. It achieves this by calculating the difference between consecutive moving averages of the price. By analyzing these differences, the tool can separate positive gains from negative losses.
Key Features and Logic
The script offers two distinct processing modes that change how it handles historical data:
- Typical Mode (Smoothed): This mode uses a sophisticated smoothing technique where it remembers previous values to calculate current results. It creates a more fluid, continuous line that reduces sudden "noise" or erratic jumps in the data, making it easier to identify long-term trends.
- Classic Mode: This is a standard calculation that evaluates the specific price changes over the chosen period without the extra smoothing. It provides a direct look at the momentum of the asset within that window.
Dynamic Volatility Bands
Unlike standard RSI indicators that use fixed horizontal lines (such as 30, 70, or 50) to signal "overbought" or "oversold" conditions, this script features a dynamic calculation:
- Deviation Tracking: The tool calculates the standard deviation—a measure of how much the price is fluctuating compared to its average movement.
- Adaptive Boundaries: It uses this deviation to create two moving boundary lines (Upper and Lower levels). These boundaries expand or contract automatically based on market volatility.
- Contextual Analysis: Because these boundaries move with the market, they provide a more "organic" view of what constitutes an extreme price movement. When the main RSI line pushes outside these dynamic bands, it suggests a stronger potential for a trend reversal or a significant move.
Summary for Users
In simple terms, this indicator tells you not just if a price is moving up or down, but how strongly it is doing so relative to its own recent history. By using dynamic boundaries instead of static ones, it helps traders distinguish between normal market "noise" and significant momentum shifts, adapting automatically to the current volatility of the market.
//+------------------------------------------------------------------+
//|                                                        F_RSI.mq4 |
//|                                               Yuriy Tokman (YTG) |
//|                                               http://ytg.com.ua/ |
//+------------------------------------------------------------------+
#property copyright "Yuriy Tokman (YTG)"
#property link      "http://ytg.com.ua/"
#property version   "1.00"
#property strict
#property indicator_separate_window
#property indicator_minimum 0
#property indicator_maximum 100
#property indicator_level1  30
#property indicator_level2  70
#property indicator_level3  50
#property indicator_buffers 3
#property indicator_color1 DodgerBlue
#property indicator_color2 Lime
#property indicator_color3 Lime
//+------------------------------------------------------------------+
//|                                                                  |
//+------------------------------------------------------------------+
enum Modz
  {
   SMMA,
   SMA,
  };
//---- input parameters
extern ENUM_APPLIED_PRICE Price=0;
// O-Close; 1-Open; 2-High; 3-Low; 4-Median; 5-Typical; 6-Weighted
extern int                RSI_PERIOD=14;
// Period of RSI
extern double             K=1;
// Deviation ratio
input Modz                Mode=0;
// RSI mode : 0 - typical(smoothed by SMMA); 1- clssic (smoothed by SMA)
//---- buffers
double B0[];
double B1[];
double B2[];
double B3[];
double B4[];
//+------------------------------------------------------------------+
//| Custom indicator initialization function                         |
//+------------------------------------------------------------------+
int OnInit()
  {
   string short_name;
//----
   IndicatorBuffers(5);
   SetIndexBuffer(3,B3);
   SetIndexBuffer(4,B4);
//---- indicator lines
   SetIndexStyle(0,DRAW_LINE);
   SetIndexBuffer(0,B0);

   SetIndexStyle(1,DRAW_LINE);
   SetIndexBuffer(1,B1);

   SetIndexStyle(2,DRAW_LINE);
   SetIndexBuffer(2,B2);
//----
   short_name="F_RSI";
   IndicatorShortName(short_name);
   SetIndexLabel(0,"RSI");
   SetIndexLabel(1,"UP_LEVEL");
   SetIndexLabel(2,"DN_LEVEL");
//----
   SetIndexDrawBegin(0,RSI_PERIOD);
//---
   return(INIT_SUCCEEDED);
  }
//+------------------------------------------------------------------+
//| Custom indicator iteration function                              |
//+------------------------------------------------------------------+
int OnCalculate(const int rates_total,
                const int prev_calculated,
                const datetime &time[],
                const double &open[],
                const double &high[],
                const double &low[],
                const double &close[],
                const long &tick_volume[],
                const long &volume[],
                const int &spread[])
  {
//----
   int    i,limit=0,counted_bars=prev_calculated;
   double rl,ng=0,ps=0;
//----
   if(Bars<=RSI_PERIOD) return(0);
//----
   if(counted_bars>0) limit=Bars-counted_bars;
   if( counted_bars < 0 )  return(0);
   if(counted_bars==0) limit=Bars-RSI_PERIOD-1;

   for(i=limit;i>=0;i--)
     {
      double sn=0.0,sp=0.0;
      if(i==Bars-RSI_PERIOD-1)
        {
         int k=Bars-2;
         //----
         while(k>=i)
           {
            rl=iMA(NULL,0,1,0,MODE_SMA,Price,k)-iMA(NULL,0,1,0,MODE_SMA,Price,k+1);
            if(rl>0) sp+=rl;
            else      sn-=rl;
            k--;
           }
         ps=sp/RSI_PERIOD;
         ng=sn/RSI_PERIOD;
        }
      else
        {
         //----
         if(Mode==0)
           {
            rl=iMA(NULL,0,1,0,MODE_SMA,Price,i)-iMA(NULL,0,1,0,MODE_SMA,Price,i+1);
            if(rl>0) sp=rl;
            else      sn=-rl;

            ps=(B3[i+1]*(RSI_PERIOD-1)+sp)/RSI_PERIOD;
            ng=(B4[i+1]*(RSI_PERIOD-1)+sn)/RSI_PERIOD;
           }
         else
         if(Mode==1)
           {
            sn=0.0;sp=0.0;
            for(int k=RSI_PERIOD-1;k>=0;k--)
              {
               rl=iMA(NULL,0,1,0,MODE_SMA,Price,i+k)-iMA(NULL,0,1,0,MODE_SMA,Price,i+k+1);
               if(rl>0) sp+=rl;
               else      sn-=rl;
              }
            ps=sp/RSI_PERIOD;
            ng=sn/RSI_PERIOD;
           }
        }
      B3[i]=ps;
      B4[i]=ng;
      if(ng==0.0) B0[i]=100.0;
      else B0[i]=100.0-100.0/(1+ps/ng);

      double S_RSI=0;
      for(int k=RSI_PERIOD-1;k>=0;k--) S_RSI+=B0[i+k];
      double A_RSI=S_RSI/RSI_PERIOD;

      double S_Sqr=0;
      for(int k=RSI_PERIOD-1;k>=0;k--) S_Sqr+=(B0[i+k]-A_RSI) *(B0[i+k]-A_RSI);
      double S_Dv=MathPow(S_Sqr/RSI_PERIOD,0.5);

      B1[i] = 50 + K * S_Dv;
      B2[i] = 50 - K * S_Dv;
     }
//--- return value of prev_calculated for next call
   return(rates_total);
  }
//+------------------------------------------------------------------+
Comments