fib generator_001
Download script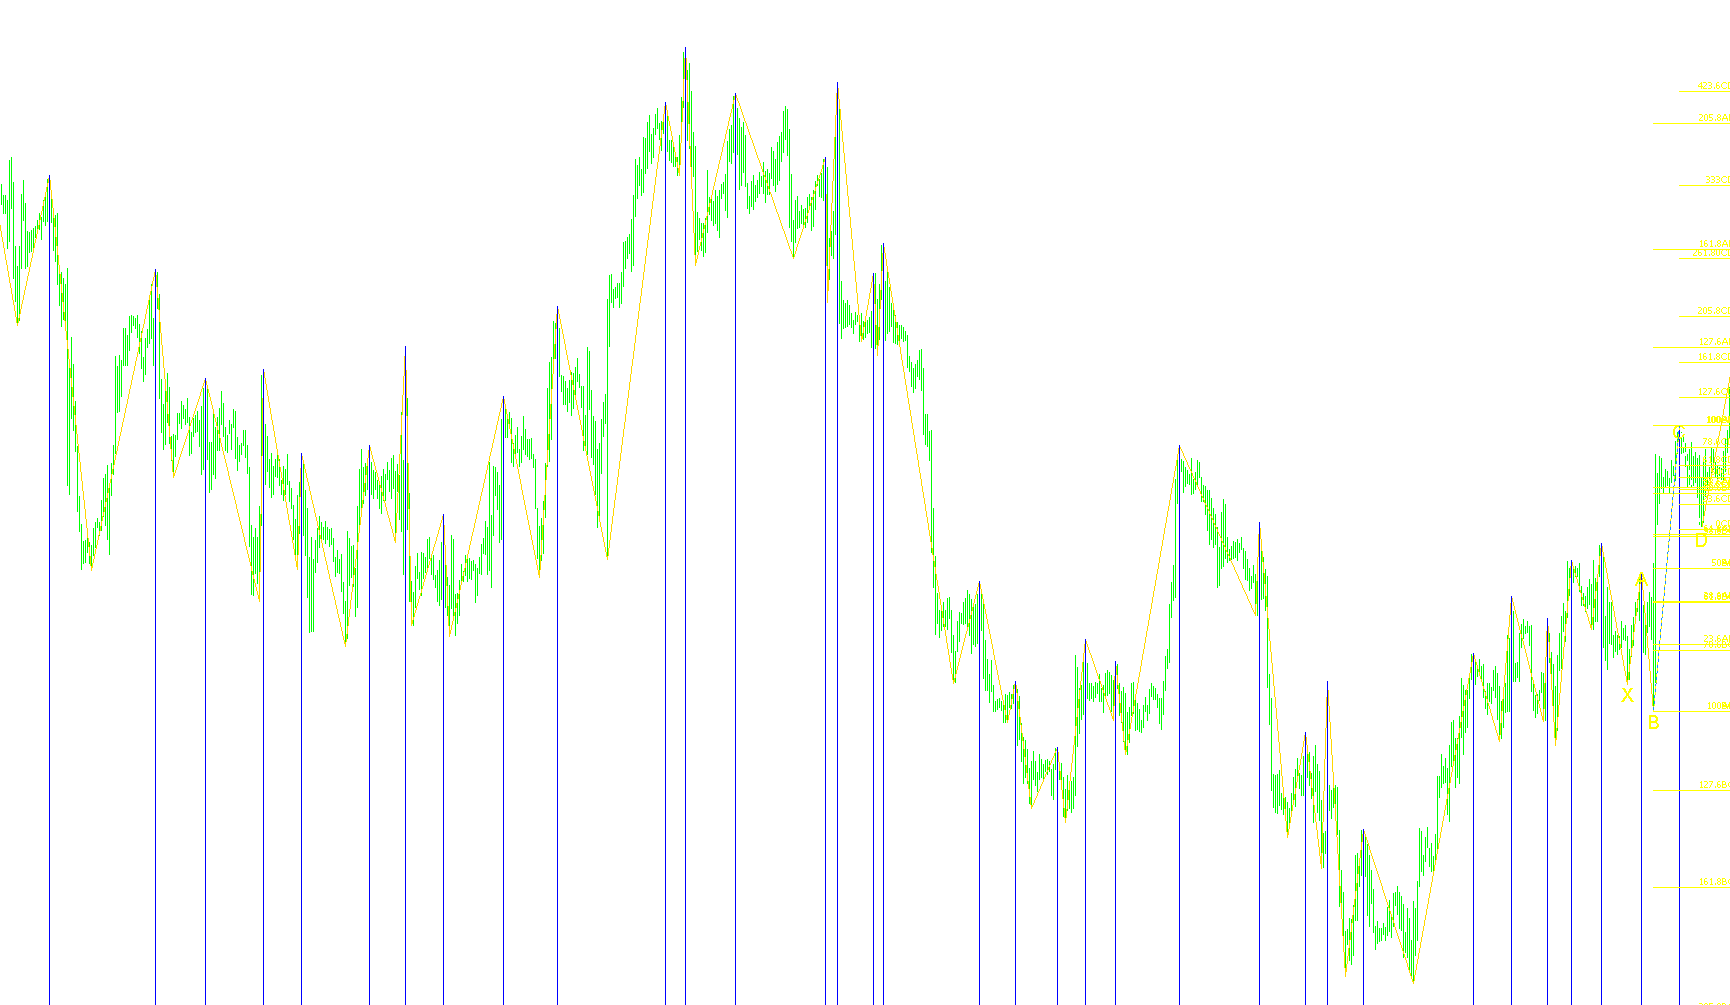
This script functions as an automated technical analysis tool designed to identify and visualize specific market structures on a trading chart. It focuses on identifying significant price pivots—specifically highs and lows—and then automatically drawing geometric patterns and Fibonacci retracement levels based on those points.
Here is a breakdown of the logic in non-technical terms:
Core Functionality
The script scans historical price data to find the most significant "turning points" in the market. It looks for extreme price movements over a user-defined period (the depth) and filters out minor fluctuations to ensure that only major structural shifts are captured. By identifying these key peaks and valleys, the script builds a framework of the market's recent history.
Automated Pattern Recognition
Once the significant highs and lows are identified, the logic organizes them into a sequence. It specifically looks for a series of connected movements (often referred to in trading as "harmonic" or "structural" components). It maps out:
- Key Pivot Points: Labeled on your chart as "X", "A", "B", "C", and "D".
- Price Relationships: The script calculates the distance between these points to determine the proportions of each move.
- Dynamic Adjustment: It checks the current market price against these historical levels to determine the trend's validity, adjusting its visual representation based on whether the price is currently trading above or below key structural zones.
Visual Output and Fibonacci Mapping
The most visible part of this script is its ability to "draw" for you automatically:
- Fibonacci Retracements: It automatically creates three distinct Fibonacci grids (Fibo1, Fibo2, and Fibo3) corresponding to different segments of the market move (labeled as AB, BC, and CD).
- Proportional Analysis: It calculates the ratios between these moves (e.g., how much of the "BC" move is being retraced relative to the "AB" move).
- On-Screen Data: The script provides a real-time data comment on your chart, showing the exact numerical distances for each market segment, allowing you to see the "math" behind the visual lines.
Summary for the User
Instead of you having to manually click on highs and lows to draw Fibonacci levels and measure price segments, this script does the "heavy lifting." It scans the recent history, identifies the most important structural points, calculates the geometric proportions of those moves, and paints the resulting Fibonacci zones onto your chart automatically. It is designed to give traders a clear, mathematical view of how the current market structure relates to previous price action.
#property indicator_chart_window
#property indicator_buffers 8
#property indicator_color1 Red
#property indicator_color2 Black
#property indicator_color3 Peru
#property indicator_color4 Aqua
#property indicator_color5 Plum
#property indicator_color6 HotPink
#property indicator_color7 White
#property indicator_color8 White


extern int ExtDepth = 12;
extern int ExtDeviation = 5;
extern int ExtBackstep = 3;
extern color XA  = Peru;
extern color AB  = Aqua;
extern color BC  = Plum;
extern color CD  = HotPink;
double g_ibuf_88[];
double g_ibuf_92[];
double g_price_96;
double g_symbol_104;
double g_price_112;
double g_symbol_120;
double g_symbol_128;
double g_symbol_136;
double g_symbol_144;
double g_symbol_152;
double g_symbol_160;
double g_symbol_168;
double g_symbol_176;
double g_symbol_184;
double g_symbol_192;
double g_symbol_200;
double g_symbol_208;
double gd_216;
double gd_224;
double gd_232;
double gd_240;
double gd_248;
double gd_256;
double gd_264;
int gi_unused_272;
int g_symbol_276;
int g_symbol_280;
int g_symbol_284;
int g_symbol_288;
int g_symbol_292;
int g_symbol_296;
int g_symbol_300;
int g_symbol_304;
int g_symbol_308;
int g_symbol_312;
double g_symbol_316;
double g_symbol_324;
double g_symbol_332;
double g_symbol_340;
double g_symbol_348;
double g_symbol_356;
double gda_412[13] = {0.0, 0.236, 0.386, 0.5, 0.618, 0.786, 1.0, 1.276, 1.618, 2.058, 2.618, 3.33, 4.236};
string gsa_416[13] = {"0", "23.6", "38.6", "50", "61.8", "78.6", "100", "127.6", "161.8", "205.8", "261.80", "333", "423.6"};
int g_arr_size_420;
string gs_dummy_424;
int g_style_444;
int g_style_448;

int init() {
   IndicatorBuffers(2);
   SetIndexStyle(0, DRAW_SECTION);
   SetIndexBuffer(0, g_ibuf_88);
   SetIndexBuffer(1, g_ibuf_92);
   SetIndexEmptyValue(0, 0.0);
   ArraySetAsSeries(g_ibuf_88, TRUE);
   ArraySetAsSeries(g_ibuf_92, TRUE);
   IndicatorShortName("Fibodrawer");
   return (0);
}

int deinit() {
   ObjectDelete("Fibo1");
   ObjectDelete("Fibo2");
   ObjectDelete("Fibo3");
   ObjectDelete("A");
   ObjectDelete("B");
   ObjectDelete("C");
   ObjectDelete("D");
   ObjectDelete("X");
   return (0);
}

int start() {
   double ld_24;
   double l_symbol_32;
   double l_symbol_40;
   double l_symbol_48;
   double ld_56;
   double ld_64;
   double l_point_0 = MarketInfo(Symbol(), MODE_POINT);
   for (int li_8 = Bars - ExtDepth; li_8 >= 0; li_8--) {
      ld_24 = Low[iLowest(NULL, 0, MODE_LOW, ExtDepth, li_8)];
      if (ld_24 == ld_64) ld_24 = 0.0;
      else {
         ld_64 = ld_24;
         if (Low[li_8] - ld_24 > ExtDeviation * Point) ld_24 = 0.0;
         else {
            for (int li_12 = 1; li_12 <= ExtBackstep; li_12++) {
               l_symbol_32 = g_ibuf_88[li_8 + li_12];
               if (l_symbol_32 != 0.0 && l_symbol_32 > ld_24) g_ibuf_88[li_8 + li_12] = 0.0;
            }
         }
      }
      g_ibuf_88[li_8] = ld_24;
      ld_24 = High[iHighest(NULL, 0, MODE_HIGH, ExtDepth, li_8)];
      if (ld_24 == ld_56) ld_24 = 0.0;
      else {
         ld_56 = ld_24;
         if (ld_24 - High[li_8] > ExtDeviation * Point) ld_24 = 0.0;
         else {
            for (li_12 = 1; li_12 <= ExtBackstep; li_12++) {
               l_symbol_32 = g_ibuf_92[li_8 + li_12];
               if (l_symbol_32 != 0.0 && l_symbol_32 < ld_24) g_ibuf_92[li_8 + li_12] = 0.0;
            }
         }
      }
      g_ibuf_92[li_8] = ld_24;
   }
   ld_56 = -1;
   int li_16 = -1;
   ld_64 = -1;
   int li_20 = -1;
   for (li_8 = Bars - ExtDepth; li_8 >= 0; li_8--) {
      l_symbol_40 = g_ibuf_88[li_8];
      l_symbol_48 = g_ibuf_92[li_8];
      if (l_symbol_40 == 0.0 && l_symbol_48 == 0.0) continue;
      if (l_symbol_48 != 0.0) {
         if (ld_56 > 0.0) {
            if (ld_56 < l_symbol_48) g_ibuf_92[li_16] = 0;
            else g_ibuf_92[li_8] = 0;
         }
         if (ld_56 < l_symbol_48 || ld_56 < 0.0) {
            ld_56 = l_symbol_48;
            li_16 = li_8;
         }
         ld_64 = -1;
      }
      if (l_symbol_40 != 0.0) {
         if (ld_64 > 0.0) {
            if (ld_64 > l_symbol_40) g_ibuf_88[li_20] = 0;
            else g_ibuf_88[li_8] = 0;
         }
         if (l_symbol_40 < ld_64 || ld_64 < 0.0) {
            ld_64 = l_symbol_40;
            li_20 = li_8;
         }
         ld_56 = -1;
      }
   }
   for (li_8 = Bars - 1; li_8 >= 0; li_8--) {
      if (li_8 >= Bars - ExtDepth) g_ibuf_88[li_8] = 0.0;
      else {
         l_symbol_32 = g_ibuf_92[li_8];
         if (l_symbol_32 != 0.0) g_ibuf_88[li_8] = l_symbol_32;
      }
   }
   int li_unused_72 = 0;
   for (int l_index_96 = 0; g_ibuf_88[l_index_96] == 0.0 && g_ibuf_92[l_index_96] == 0.0; l_index_96++) {
   }
   int li_76 = l_index_96;
   for (l_index_96++; g_ibuf_88[l_index_96] == 0.0 && g_ibuf_92[l_index_96] == 0.0; l_index_96++) {
   }
   int li_80 = l_index_96;
   for (l_index_96++; g_ibuf_88[l_index_96] == 0.0 && g_ibuf_92[l_index_96] == 0.0; l_index_96++) {
   }
   int li_84 = l_index_96;
   for (l_index_96++; g_ibuf_88[l_index_96] == 0.0 && g_ibuf_92[l_index_96] == 0.0; l_index_96++) {
   }
   int li_88 = l_index_96;
   for (l_index_96++; g_ibuf_88[l_index_96] == 0.0 && g_ibuf_92[l_index_96] == 0.0; l_index_96++) {
   }
   int li_92 = l_index_96;
   g_symbol_184 = High[li_76];
   g_symbol_192 = Low[li_76];
   g_symbol_168 = High[li_80];
   g_symbol_176 = Low[li_80];
   g_symbol_152 = High[li_84];
   g_symbol_160 = Low[li_84];
   g_symbol_136 = High[li_88];
   g_symbol_144 = Low[li_88];
   g_symbol_200 = High[li_92];
   g_symbol_208 = Low[li_92];
   g_symbol_288 = Time[li_76];
   g_symbol_284 = Time[li_80];
   g_symbol_280 = Time[li_84];
   g_symbol_276 = Time[li_88];
   gi_unused_272 = Time[li_92];
   if (g_symbol_184 > g_symbol_168) {
      g_symbol_304 = g_symbol_284;
      g_symbol_324 = g_symbol_176;
      g_symbol_292 = g_symbol_288;
      g_symbol_316 = g_symbol_184;
      g_symbol_308 = g_symbol_280;
      g_symbol_340 = g_symbol_152;
      g_symbol_296 = g_symbol_284;
      g_symbol_332 = g_symbol_176;
      if (g_symbol_144 <= g_symbol_176 && g_symbol_184 <= g_symbol_152) {
         g_symbol_312 = g_symbol_276;
         g_symbol_356 = g_symbol_144;
         g_symbol_300 = g_symbol_280;
         g_symbol_348 = g_symbol_152;
      }
      if (g_symbol_144 <= g_symbol_176 && g_symbol_184 > g_symbol_152) {
         g_symbol_312 = g_symbol_280;
         g_symbol_356 = g_symbol_152;
         g_symbol_300 = g_symbol_276;
         g_symbol_348 = g_symbol_144;
      }
      if (Close[0] > g_symbol_152) {
         g_style_448 = 2;
         g_style_444 = 2;
      } else {
         g_style_448 = 0;
         g_style_444 = 0;
      }
   }
   if (g_symbol_192 < g_symbol_176) {
      g_symbol_304 = g_symbol_284;
      g_symbol_324 = g_symbol_168;
      g_symbol_292 = g_symbol_288;
      g_symbol_316 = g_symbol_192;
      if (g_symbol_160 < g_symbol_192) {
         g_symbol_296 = g_symbol_284;
         g_symbol_332 = g_symbol_168;
         g_symbol_308 = g_symbol_280;
         g_symbol_340 = g_symbol_160;
      }
      if (g_symbol_160 >= g_symbol_192) {
         g_symbol_308 = g_symbol_280;
         g_symbol_340 = g_symbol_160;
         g_symbol_296 = g_symbol_284;
         g_symbol_332 = g_symbol_168;
      }
      if (g_symbol_136 > g_symbol_168) {
      }
      if (g_symbol_136 > g_symbol_168 && g_symbol_192 <= g_symbol_160) {
         g_symbol_312 = g_symbol_280;
         g_symbol_356 = g_symbol_160;
         g_symbol_300 = g_symbol_276;
         g_symbol_348 = g_symbol_136;
      }
      if (g_symbol_136 > g_symbol_168 && g_symbol_192 > g_symbol_160) {
         g_symbol_312 = g_symbol_276;
         g_symbol_356 = g_symbol_136;
         g_symbol_300 = g_symbol_280;
         g_symbol_348 = g_symbol_160;
      }
      if (Close[0] < g_symbol_160) {
         g_style_448 = 2;
         g_style_444 = 2;
      } else {
         g_style_448 = 0;
         g_style_444 = 0;
      }
   }
   if (g_symbol_192 < g_symbol_176) {
      g_symbol_120 = g_symbol_192;
      g_price_112 = g_symbol_168 + 11.0 * l_point_0;
      g_symbol_104 = g_symbol_160;
      g_price_96 = g_symbol_136 + 11.0 * l_point_0;
      g_symbol_128 = g_symbol_208;
      gd_216 = (g_symbol_136 - g_symbol_208) / l_point_0;
      gd_224 = (g_symbol_136 - g_symbol_160) / l_point_0;
      gd_232 = (g_symbol_168 - g_symbol_160) / l_point_0;
      gd_240 = (g_symbol_168 - g_symbol_192) / l_point_0;
      Comment("XA= ", gd_216, " AB=", gd_224, " BC=", gd_232, " CD=", gd_240);
   }
   if (g_symbol_184 > g_symbol_168) {
      g_symbol_120 = g_symbol_184;
      g_price_112 = g_symbol_176;
      g_symbol_104 = g_symbol_152;
      g_price_96 = g_symbol_144;
      g_symbol_128 = g_symbol_200;
      gd_216 = (g_symbol_200 - g_symbol_144) / l_point_0;
      gd_224 = (g_symbol_152 - g_symbol_144) / l_point_0;
      gd_232 = (g_symbol_152 - g_symbol_176) / l_point_0;
      gd_240 = (g_symbol_184 - g_symbol_176) / l_point_0;
      gd_248 = gd_224 / gd_216;
      gd_256 = gd_232 / gd_224;
      gd_264 = gd_240 / gd_232;
      Comment("XA= ", gd_216, " AB=", gd_224, " BC=", gd_232, " CD=", gd_240, " AB/XA=", gd_248, " BC/AB=", gd_256, " CD/BC=", gd_264);
   }

   ObjectCreate("X", OBJ_TEXT, 0, Time[li_92], g_symbol_128);
   ObjectSetText("X", "X", 14, "Arial", Yellow);
   ObjectCreate("A", OBJ_TEXT, 0, Time[li_88], g_price_96);
   ObjectSetText("A", "A", 14, "Arial", Yellow);
   ObjectCreate("B", OBJ_TEXT, 0, Time[li_84], g_symbol_104);
   ObjectSetText("B", "B", 14, "Arial", Yellow);
   ObjectCreate("C", OBJ_TEXT, 0, Time[li_80], g_price_112);
   ObjectSetText("C", "C", 14, "Arial", Yellow);
   ObjectCreate("D", OBJ_TEXT, 0, Time[li_76], g_symbol_120);
   ObjectSetText("D", "D", 14, "Arial", Yellow);
   ObjectCreate("Fibo1", OBJ_FIBO, 0, g_symbol_304, g_symbol_324, g_symbol_292, g_symbol_316);
   ObjectSet("Fibo1", OBJPROP_COLOR, White);
   ObjectSet("Fibo1", OBJPROP_STYLE, STYLE_SOLID);
   ObjectCreate("Fibo2", OBJ_FIBO, 0, g_symbol_308, g_symbol_340, g_symbol_296, g_symbol_332);
   ObjectSet("Fibo2", OBJPROP_COLOR, Yellow);
   ObjectSet("Fibo2", OBJPROP_STYLE, g_style_444);
   if (g_symbol_348 > 0.0) {
      ObjectCreate("Fibo3", OBJ_FIBO, 0, g_symbol_312, g_symbol_356, g_symbol_300, g_symbol_348);
      ObjectSet("Fibo3", OBJPROP_COLOR, DodgerBlue);
      ObjectSet("Fibo3", OBJPROP_STYLE, STYLE_SOLID);
      ObjectSet("Fibo3", OBJPROP_STYLE, g_style_448);
   }
   g_arr_size_420 = ArraySize(gda_412);
   ObjectSet("Fibo1", OBJPROP_FIBOLEVELS, g_arr_size_420);
   ObjectSet("Fibo2", OBJPROP_FIBOLEVELS, g_arr_size_420);
   ObjectSet("Fibo3", OBJPROP_FIBOLEVELS, g_arr_size_420);
   for (int li_100 = 0; li_100 < g_arr_size_420; li_100++) {
      ObjectSet("Fibo1", li_100 + 210, gda_412[li_100]);
      ObjectSetFiboDescription("Fibo1", li_100, gsa_416[li_100] + "CD");
      ObjectSet("Fibo2", li_100 + 210, gda_412[li_100]);
      ObjectSetFiboDescription("Fibo2", li_100, gsa_416[li_100] + "BC");
      ObjectSet("Fibo3", li_100 + 210, gda_412[li_100]);
      ObjectSetFiboDescription("Fibo3", li_100, gsa_416[li_100] + "AB");

   }
   return (0);
}
Comments