Fib_Pivots_02_v2
Download script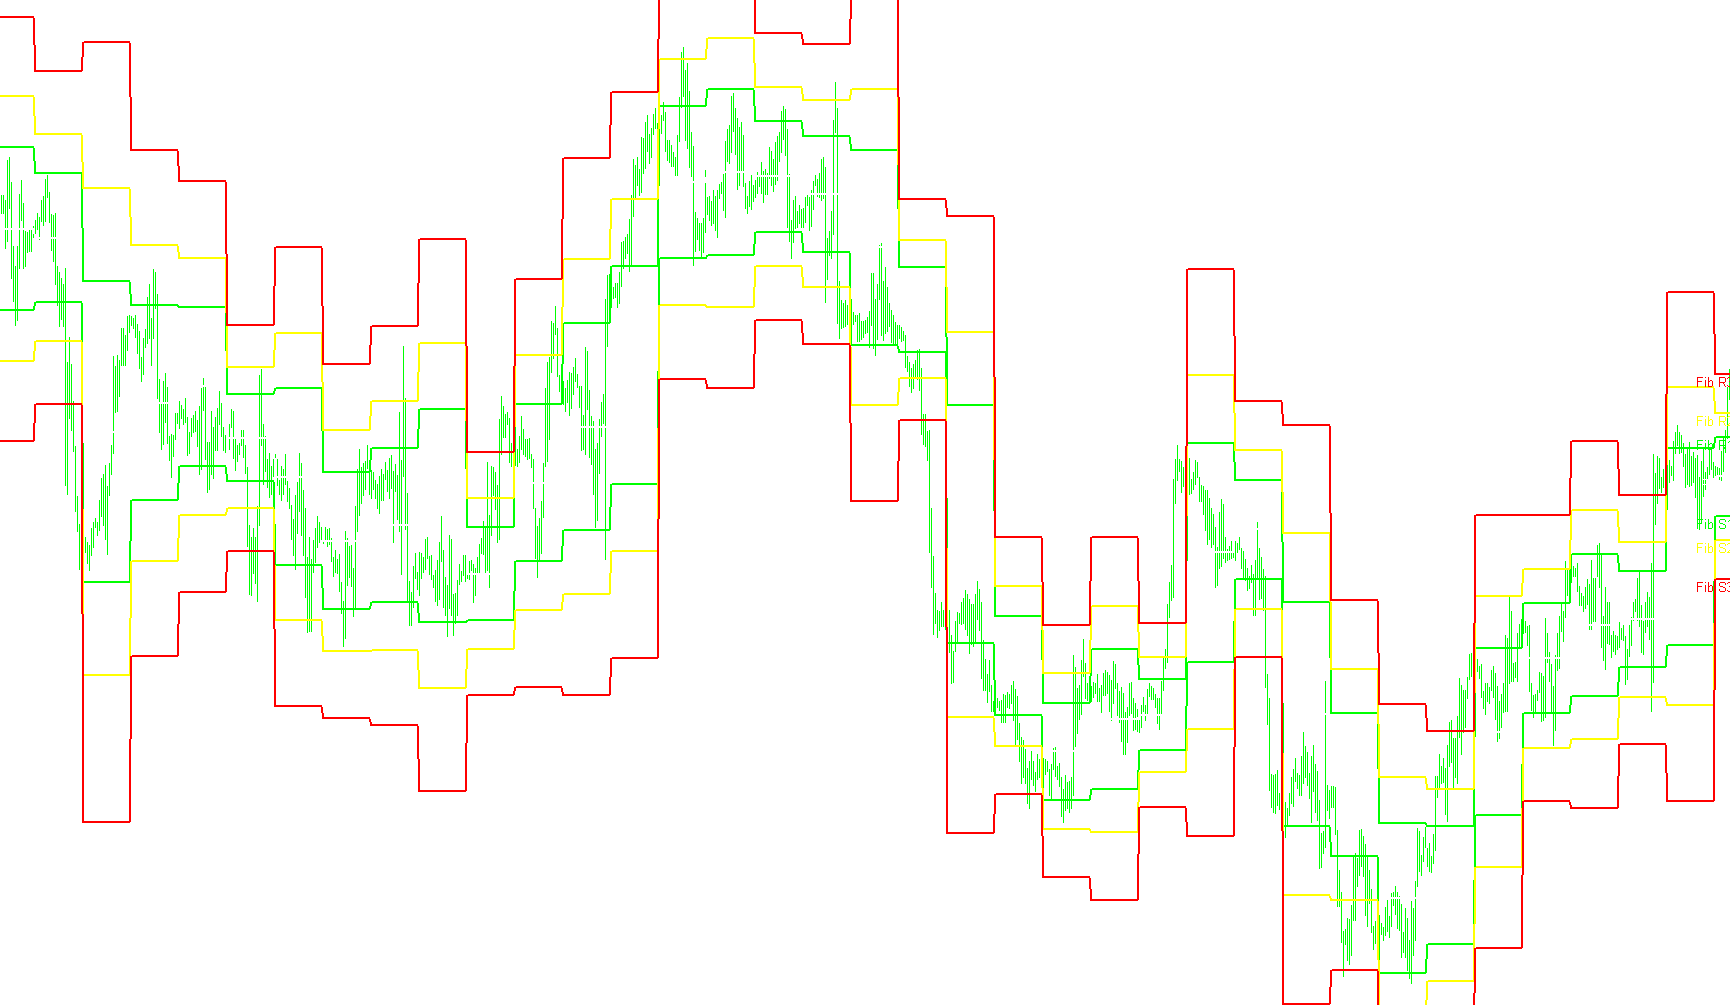
This tool is designed to automatically calculate and display key price levels on your trading chart, blending two popular technical analysis methods: Pivot Points and Fibonacci Retracements. By combining these, the script provides a comprehensive map of potential support and resistance zones to help traders identify where price might stall or reverse.
Core Logic & Functionality
The script operates by scanning historical price data to identify the highest highs and lowest lows of preceding trading sessions. It uses this information to generate several specific price levels for each new day:
1. The Pivot Point (The Anchor) The primary "Pivot" acts as the central balance point for the current period. It is calculated by taking the average of the previous day's high, low, and closing prices. This serves as the baseline from which all other levels are derived.
2. Fibonacci Support and Resistance Levels Unlike standard pivot points that use fixed percentages, this script applies Fibonacci ratios to the range of the previous session (the difference between the high and the low). It identifies four distinct zones:
- Immediate Levels (S1/R1): These are calculated using the 0.382 ratio. They represent the first major areas of interest near the pivot.
- Intermediate Levels (S2/R2): These use the 0.618 "Golden Ratio," identifying stronger psychological levels where price often reacts significantly.
- Extreme Levels (S3/R3): Calculated using a high-extension ratio (0.99), these represent the outer boundaries of the trading range, indicating areas of deep overbought or oversold conditions.
How it Works on Your Chart
- Automatic Updates: The script automatically detects when a new trading day begins. As soon as the day changes, it recalculates all levels based on the completed data from the previous period.
- Visual Mapping: It draws seven distinct horizontal lines on your chart, color-coded for clarity:
- White: The Central Pivot Point.
- Lime: The primary Fibonacci Support and Resistance (S1/R1).
- Yellow: The secondary Fibonacci Support and Resistance (S2/R2).
- Red: The extreme Fibonacci Support and Resistance (S3/R3).
- Dynamic Positioning: The script constantly updates the position of these lines as new price data flows in, ensuring that the levels remain relevant to the current market movement.
Summary for Traders
Instead of manually calculating complex formulas, this script provides a visual "roadmap" of the market. By looking at where these lines appear, traders can better anticipate areas where buyers might step in (Support) or where sellers might take control (Resistance), allowing for more disciplined entry and exit strategies.
//+------------------------------------------------------------------+
//|                                                   Pivot_Fibs.mq4 |
//|                            Copyright © 2006, Archer Trading, LLC |
//|                                    http://www.archertrading.net/ |
//+------------------------------------------------------------------+
#property copyright "Archer Trading, LLC"
#property link      "http://www.archertrading.net/"
//----
#property indicator_chart_window
#property indicator_buffers 7
#property indicator_color1 White
#property indicator_color2 Lime
#property indicator_color3 Lime
#property indicator_color4 Yellow
#property indicator_color5 Yellow
#property indicator_color6 Red
#property indicator_color7 Red
//----
double PBuffer[];
double S1Buffer[];
double R1Buffer[];
double S2Buffer[];
double R2Buffer[];
double S3Buffer[];
double R3Buffer[];
double S0Buffer[];
double R0Buffer[];
string Pivot="Pivot Point",FibS1="S 1", FibR1="R 1";
string FibS2="S 2", FibR2="R 2", FibS3="S 3", FibR3="R 3";
int fontsize=10;
double P,R,S1,R1,S2,R2,S3,R3;
double LastHigh,LastLow,x;
//+------------------------------------------------------------------+
//| Custor indicator deinitialization function                       |
//+------------------------------------------------------------------+
int deinit()
  {
   ObjectDelete("Pivot");
   ObjectDelete("FibS1");
   ObjectDelete("FibR1");
   ObjectDelete("FibS2");
   ObjectDelete("FibR1");
   ObjectDelete("FibS3");
   ObjectDelete("FibR2");
//----
   return(0);
  }
//+------------------------------------------------------------------+
//| Custom indicator initialization function                         |
//+------------------------------------------------------------------+
int init()
  {
   string short_name;
//----
   SetIndexStyle(0,DRAW_LINE,0,2,White);
   SetIndexStyle(1,DRAW_LINE,0,2,Lime);
   SetIndexStyle(2,DRAW_LINE,0,2,Lime);
   SetIndexStyle(3,DRAW_LINE,0,2,Yellow);
   SetIndexStyle(4,DRAW_LINE,0,2,Yellow);
   SetIndexStyle(5,DRAW_LINE,0,2,Red);
   SetIndexStyle(6,DRAW_LINE,0,2,Red);
   SetIndexBuffer(0,PBuffer);
   SetIndexBuffer(1,S1Buffer);
   SetIndexBuffer(2,R1Buffer);
   SetIndexBuffer(3,S2Buffer);
   SetIndexBuffer(4,R2Buffer);
   SetIndexBuffer(5,S3Buffer);
   SetIndexBuffer(6,R3Buffer);
//---- name for DataWindow and indicator subwindow label
   short_name="Fibonacci Pivot Points";
   IndicatorShortName(short_name);
   SetIndexLabel(0,short_name);
//----
   SetIndexDrawBegin(0,1);
//----
//----
   return(0);
  }
//+------------------------------------------------------------------+
//| Custom indicator iteration function                              |
//+------------------------------------------------------------------+
int start()
  {
   int    counted_bars=IndicatorCounted();
   int limit, i;
//---- indicator calculation
   if (counted_bars==0)
     {
      x=Period();
      if (x>240) return(-1);
      ObjectCreate("Pivot", OBJ_TEXT, 0, 0,0);
      ObjectSetText("Pivot", "Pivot",fontsize,"Arial",White);
      ObjectCreate("FibS1", OBJ_TEXT, 0, 0, 0);
      ObjectSetText("FibS1", "Fib S1",fontsize,"Arial",Lime);
      ObjectCreate("FibR1", OBJ_TEXT, 0, 0, 0);
      ObjectSetText("FibR1", "Fib R1",fontsize,"Arial",Lime);
      ObjectCreate("FibS2", OBJ_TEXT, 0, 0, 0);
      ObjectSetText("FibS2", "Fib S2",fontsize,"Arial",Yellow);
      ObjectCreate("FibR2", OBJ_TEXT, 0, 0, 0);
      ObjectSetText("FibR2", "Fib R2",fontsize,"Arial",Yellow);
      ObjectCreate("FibS3", OBJ_TEXT, 0, 0, 0);
      ObjectSetText("FibS3", "Fib S3",fontsize,"Arial",Red);
      ObjectCreate("FibR3", OBJ_TEXT, 0, 0, 0);
      ObjectSetText("FibR3", "Fib R3",fontsize,"Arial",Red);
     }
   if(counted_bars<0) return(-1);
//---- last counted bar will be recounted
   //   if(counted_bars>0) counted_bars--;
   limit=(Bars-counted_bars)-1;
//----
   for(i=limit; i>=0;i--)
     {
      if (High[i+1]>LastHigh) LastHigh=High[i+1];
      if (Low[i+1]<LastLow) LastLow=Low[i+1];
      if (TimeDay(Time[i])!=TimeDay(Time[i+1]))
        {
         P=(LastHigh+LastLow+Close[i+1])/3;
         R=LastHigh-LastLow;
         R1=P + (R * 0.382);
         S1=P - (R * 0.382);
         R2=P + (R * 0.618);
         S2=P - (R * 0.618);
         R3=P + (R * 0.99);
         S3=P - (R * 0.99);
         LastLow=Open[i]; LastHigh=Open[i];
//----
         ObjectMove("Pivot", 0, Time[i],P);
         ObjectMove("FibS1", 0, Time[i],S1);
         ObjectMove("FibR1", 0, Time[i],R1);
         ObjectMove("FibS2", 0, Time[i],S2);
         ObjectMove("FibR2", 0, Time[i],R2);
         ObjectMove("FibS3", 0, Time[i],S3);
         ObjectMove("FibR3", 0, Time[i],R3);
        }
      PBuffer[i]=P;
      S1Buffer[i]=S1;
      R1Buffer[i]=R1;
      S2Buffer[i]=S2;
      R2Buffer[i]=R2;
      S3Buffer[i]=S3;
      R3Buffer[i]=R3;
     }
//----
   return(0);
  }
//+------------------------------------------------------------------+
Comments