Fibonacci Pivots THV
Download script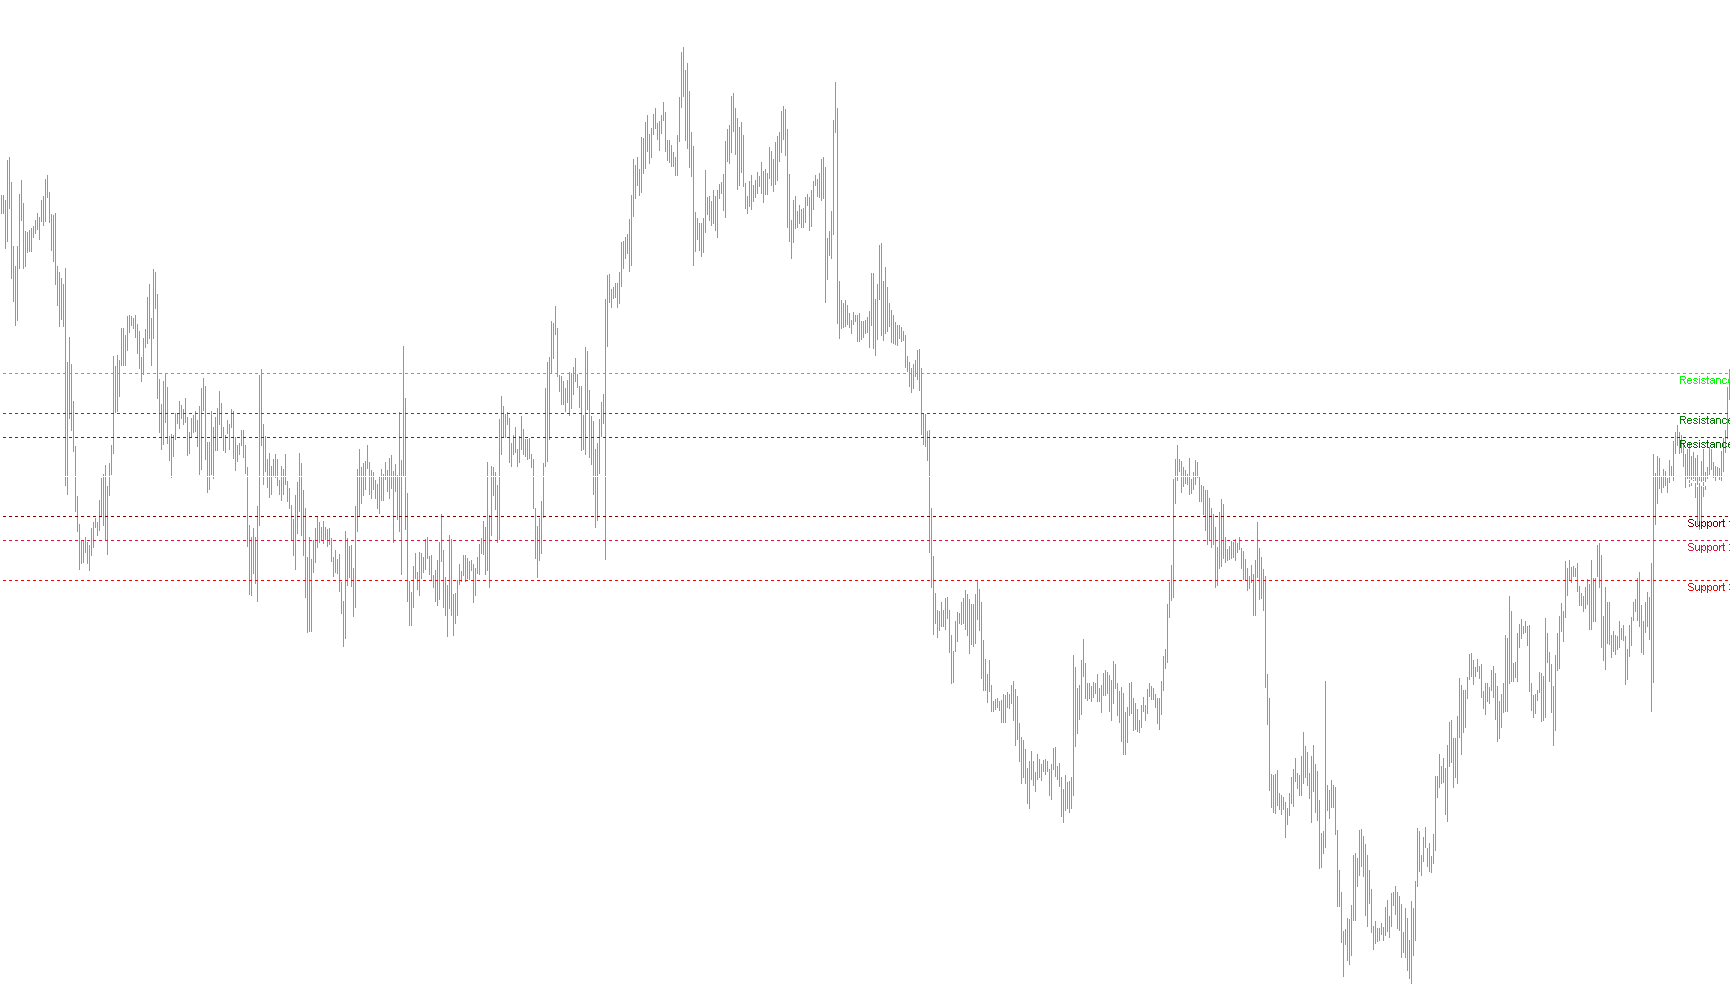
This script is a specialized technical analysis tool designed for the MetaTrader 4 platform. It automatically calculates and visualizes key price levels—specifically Pivot Points and Fibonacci-based Support/Resistance levels—directly on your trading chart based on historical price data.
Core Functionality
The primary purpose of this tool is to provide traders with a clear "roadmap" of potential price turning points for the current trading day. Instead of requiring manual calculations, the script looks back at the previous day's market activity to project these levels onto the current chart.
How the Logic Works
1. Data Collection (The Source) To determine where the price might move today, the script first identifies three critical values from the previous trading session:
- The High: The highest price reached.
- The Low: The lowest price reached.
- The Close: The final price at which the market settled.
The script includes smart logic to handle weekends. If you are viewing the markets on a Monday, it automatically seeks out the data from Friday to ensure the calculations remain consistent.
2. The Pivot Calculation Once it has these three values, it calculates the Standard Pivot Point. This is essentially the "balance point" of the market for the day, calculated by averaging the previous day's high, low, and closing price.
3. Fibonacci Resistance & Support Moving beyond standard pivots, the script applies Fibonacci ratios to the total range of the previous day (the distance between the High and the Low). It uses these specific ratios to project:
- Resistance Levels (R1, R2, R3): These represent "ceilings" where the price may face difficulty moving higher.
- Support Levels (S1, S2, S3): These represent "floors" where the price may find buying interest and stop falling.
Visual Presentation on Your Chart
The script handles all the heavy lifting of the math so you can focus on the visual analysis:
- Dynamic Drawing: It automatically draws horizontal lines across your chart for every calculated level.
- Color Coding: To make the chart easy to read at a glance, it uses a distinct color scheme:
- Resistance Levels are displayed in shades of Green and Lime.
- Support Levels are displayed in shades of Red and Maroon.
- The Pivot Level is highlighted as a central reference point.
- Labeling: Each line is clearly labeled (e.g., "Resistance 1", "Pivot level") so there is no confusion about which level is being displayed.
- Automatic Cleanup: When you remove the indicator from your chart, the script is programmed to clean up after itself, deleting all the drawn lines and labels so your chart remains tidy.
Summary for the Trader
This tool simplifies technical analysis by converting raw historical data into a visual "grid." By seeing these levels automatically plotted, you can better identify potential areas where the market might stall or reverse, allowing for more informed decision-making regarding entries and exits.
//+------------------------------------------------------------------+
//|                                                   FiboPiv_v1.mq4 |
//|                                                          Kalenzo |
//|                                      bartlomiej.gorski@gmail.com |
//+------------------------------------------------------------------+
#property copyright "Kalenzo"
#property link      "bartlomiej.gorski@gmail.com"

#property indicator_chart_window
extern color pivotColor = White;
extern color pivotlevelColor = White;
//+------------------------------------------------------------------+
//| Custom indicator initialization function                         |
//+------------------------------------------------------------------+
int init()
  {
//---- indicators
//----
   return(0);
  }
//+------------------------------------------------------------------+
//| Custom indicator deinitialization function                       |
//+------------------------------------------------------------------+
int deinit()
  {
//----
   ObjectDelete("S1");
   ObjectDelete("S2");
   ObjectDelete("S3");
   ObjectDelete("R1");
   ObjectDelete("R2");
   ObjectDelete("R3");
   ObjectDelete("PIVIOT");
   ObjectDelete("Support 1");
   ObjectDelete("Support 2");
   ObjectDelete("Support 3");
   ObjectDelete("Piviot level");
   ObjectDelete("Resistance 1");
   ObjectDelete("Resistance 2");
   ObjectDelete("Resistance 3");
   Comment(" ");
//----
   return(0);
  }
//+------------------------------------------------------------------+
//| Custom indicator iteration function                              |
//+------------------------------------------------------------------+
int start()
  {

//----
double rates[1][6],yesterday_close,yesterday_high,yesterday_low;
ArrayCopyRates(rates, Symbol(), PERIOD_D1);

if(DayOfWeek() == 1)
{
   if(TimeDayOfWeek(iTime(Symbol(),PERIOD_D1,1)) == 5)
   {
       yesterday_close = rates[1][4];
       yesterday_high = rates[1][3];
       yesterday_low = rates[1][2];
   }
   else
   {
      for(int d = 5;d>=0;d--)
      {
         if(TimeDayOfWeek(iTime(Symbol(),PERIOD_D1,d)) == 5)
         {
             yesterday_close = rates[d][4];
             yesterday_high = rates[d][3];
             yesterday_low = rates[d][2];
         }

      }
   }
}
else
{
    yesterday_close = rates[1][4];
    yesterday_high = rates[1][3];
    yesterday_low = rates[1][2];
}


//---- Calculate Pivots

Comment("\nYesterday quotations:\nH ",yesterday_high,"\nL ",yesterday_low, "\nC ",yesterday_close);
double R = yesterday_high - yesterday_low;//range
double p = (yesterday_high + yesterday_low + yesterday_close)/3;// Standard Pivot
double r3 = p + (R * 1.000);
double r2 = p + (R * 0.618);
double r1 = p + (R * 0.382);
double s1 = p - (R * 0.382);
double s2 = p - (R * 0.618);
double s3 = p - (R * 1.000);

drawLine(r3,"R3", Lime,0);
drawLabel("Resistance 3",r3,Lime);
drawLine(r2,"R2", Green,0);
drawLabel("Resistance 2",r2,Green);
drawLine(r1,"R1", DarkGreen,0);
drawLabel("Resistance 1",r1,DarkGreen);

drawLine(p,"PIVOT",pivotColor,1);
drawLabel("Pivot level",p,pivotlevelColor);

drawLine(s1,"S1",Maroon,0);
drawLabel("Support 1",s1,Maroon);
drawLine(s2,"S2",Crimson,0);
drawLabel("Support 2",s2,Crimson);
drawLine(s3,"S3",Red,0);
drawLabel("Support 3",s3,Red);


//----
   return(0);
  }
//+------------------------------------------------------------------+
void drawLabel(string name,double lvl,color Color)
{
    if(ObjectFind(name) != 0)
    {
        ObjectCreate(name, OBJ_TEXT, 0, Time[10], lvl);
        ObjectSetText(name, name, 8, "Arial", EMPTY);
        ObjectSet(name, OBJPROP_COLOR, Color);
    }
    else
    {
        ObjectMove(name, 0, Time[10], lvl);
    }
}


void drawLine(double lvl,string name, color Col,int type)
{
         if(ObjectFind(name) != 0)
         {
            ObjectCreate(name, OBJ_HLINE, 0, Time[0], lvl,Time[0],lvl);

            if(type == 1)
            ObjectSet(name, OBJPROP_STYLE, STYLE_SOLID);
            else
            ObjectSet(name, OBJPROP_STYLE, STYLE_DOT);

            ObjectSet(name, OBJPROP_COLOR, Col);
            ObjectSet(name,OBJPROP_WIDTH,1);

         }
         else
         {
            ObjectDelete(name);
            ObjectCreate(name, OBJ_HLINE, 0, Time[0], lvl,Time[0],lvl);

            if(type == 1)
            ObjectSet(name, OBJPROP_STYLE, STYLE_SOLID);
            else
            ObjectSet(name, OBJPROP_STYLE, STYLE_DOT);

            ObjectSet(name, OBJPROP_COLOR, Col);
            ObjectSet(name,OBJPROP_WIDTH,1);

         }
}
Comments