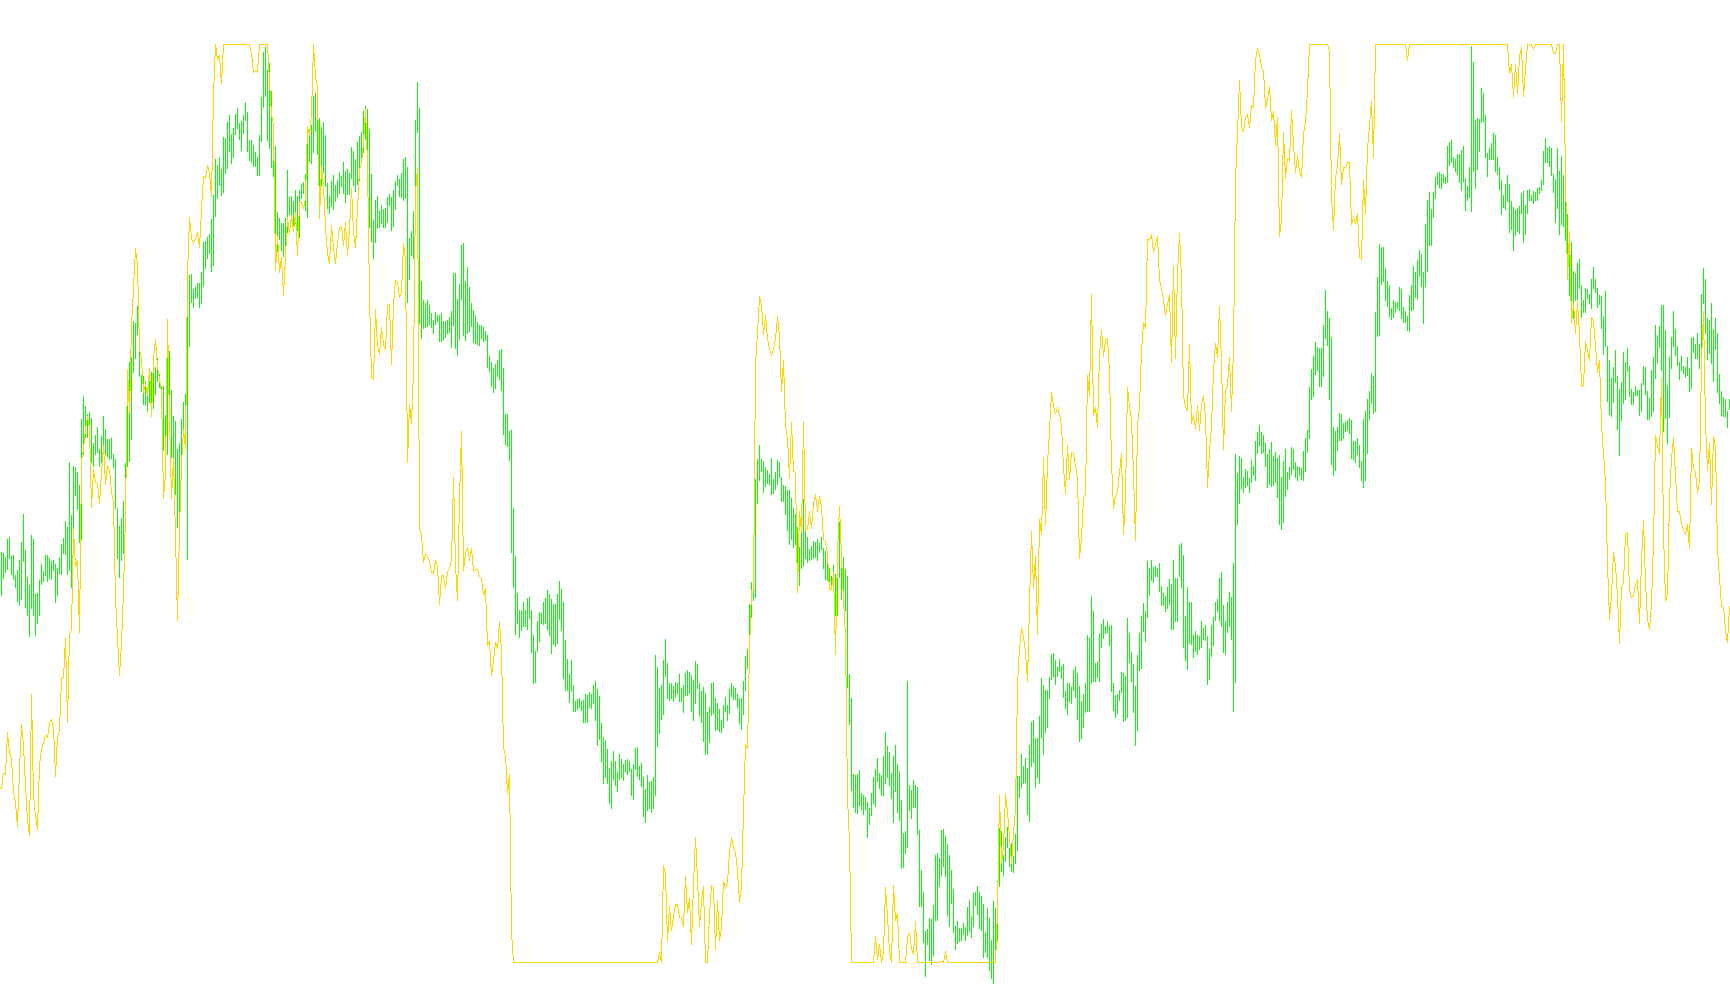
The Figurelli RSI is a customized technical analysis tool designed to measure the momentum and strength of price movements in a financial market. Unlike standard oscillators that might react quickly to minor fluctuations, this script utilizes a specific smoothing logic to identify more significant trends, making it suitable for traders who prefer a clearer view of market dynamics.
Core Mechanics
The tool operates by analyzing price changes over a user-defined timeframe (the "period"). It distinguishes between upward movements and downward movements independently:
- Positive Movement Tracking: The script identifies every instance where the price closes higher than the previous period, accumulating these gains.
- Negative Movement Tracking: Simultaneously, it tracks every instance where the price closes lower, capturing the magnitude of those losses.
Smoothing and Calculation
Instead of looking only at the most recent data point, the logic incorporates a "memory" effect. For each new price change, the tool blends the current movement with the average of previous movements. This creates a weighted calculation that ensures the indicator moves smoothly across the chart rather than jumping erratically.
Visual Interpretation
The final output is processed through a series of adjustments to make it easier for a human observer to read:
- Relative Strength: It calculates the ratio between upward and downward momentum.
- Scaling: The result is multiplied by a "gain" factor, which determines the sensitivity and intensity of the visual movement.
- Normalization: To ensure the data remains readable on a standard scale (ranging from 0 to 100), the script applies limits. This prevents extreme price spikes from pushing the indicator off the visible chart boundaries, keeping the fluctuations centered and consistent.
Practical Use
By providing a smoothed representation of momentum, this tool helps traders visualize whether the current market trend is gaining strength or losing steam. It filters out "noise" to highlight the underlying flow of the market, allowing for a more stable interpretation of price action over time.
//+------------------------------------------------------------------+
//|                                                Figurelli RSI.mq4 |
//|                              Copyright © 2011, Rogerio Figurelli |
//|                                       http://www.trajecta.com.br |
//+------------------------------------------------------------------+
#property copyright "Copyright © 2011, Rogerio Figurelli"
#property link      "http://www.trajecta.com.br"

#property indicator_separate_window
#property indicator_minimum 0
#property indicator_maximum 100
#property indicator_buffers 1
#property indicator_color1 Red

//---- input parameters
extern int period=120;
extern int gain=10;

//---- global vars
static double buffer_indicator[];
static double buffer_positive[];
static double buffer_negative[];
static string name;

//+------------------------------------------------------------------+
//| Initialization                                                   |
//+------------------------------------------------------------------+
int init() {
   IndicatorBuffers(3);
   SetIndexStyle(0,DRAW_LINE);
   SetIndexBuffer(0,buffer_indicator);
   name="Figurelli RSI ("+period+","+gain+")";
   IndicatorShortName(name);
   SetIndexLabel(0,name);
   SetIndexDrawBegin(0,period);
   SetIndexBuffer(1,buffer_positive);
   SetIndexBuffer(2,buffer_negative);
   return(0);
}
//+------------------------------------------------------------------+
//| Figurelli Relative Strength Index                                |
//+------------------------------------------------------------------+
int start() {
   int i,j;
   int counted_bars=IndicatorCounted();
   double diff;
   double negative,n;
   double positive,p;

   if (Bars<=period) return(0);
   if (counted_bars<1) {
      for (i=1;i<=period;i++)
         buffer_indicator[Bars-i]=0;
   }
   i=Bars-period-1;
   if (counted_bars>=period)
      i=Bars-counted_bars-1;
   while (i>=0) {
      n=0;
      p=0;
      if (i==(Bars-period-1)) {
         j=Bars-2;
         while (j>=i) {
            diff=Close[j]-Close[j+1];
            if (diff>0)
               p+=diff;
            else
               n-=diff;
            j--;
         }
         positive=p/period;
         negative=n/period;
      }
      else {
         diff=Close[i]-Close[i+1];
         if (diff>0)
            p=diff;
         else
            n=-diff;
         positive=(buffer_positive[i+1]*(period-1)+p)/period;
         negative=(buffer_negative[i+1]*(period-1)+n)/period;
      }
      buffer_positive[i]=positive;
      buffer_negative[i]=negative;
      if (negative==0)
         buffer_indicator[i]=0;
      else
         buffer_indicator[i]=100-100/(1+positive/negative);
      buffer_indicator[i]-=50;
      buffer_indicator[i]*=gain;
      if (buffer_indicator[i]<-50)
         buffer_indicator[i]=-50;
      if (buffer_indicator[i]>50)
         buffer_indicator[i]=50;
      buffer_indicator[i]+=50;
      i--;
   }
   return(0);
}
//+------------------------------------------------------------------+
Comments