Fisher_org_v12_v2
Download script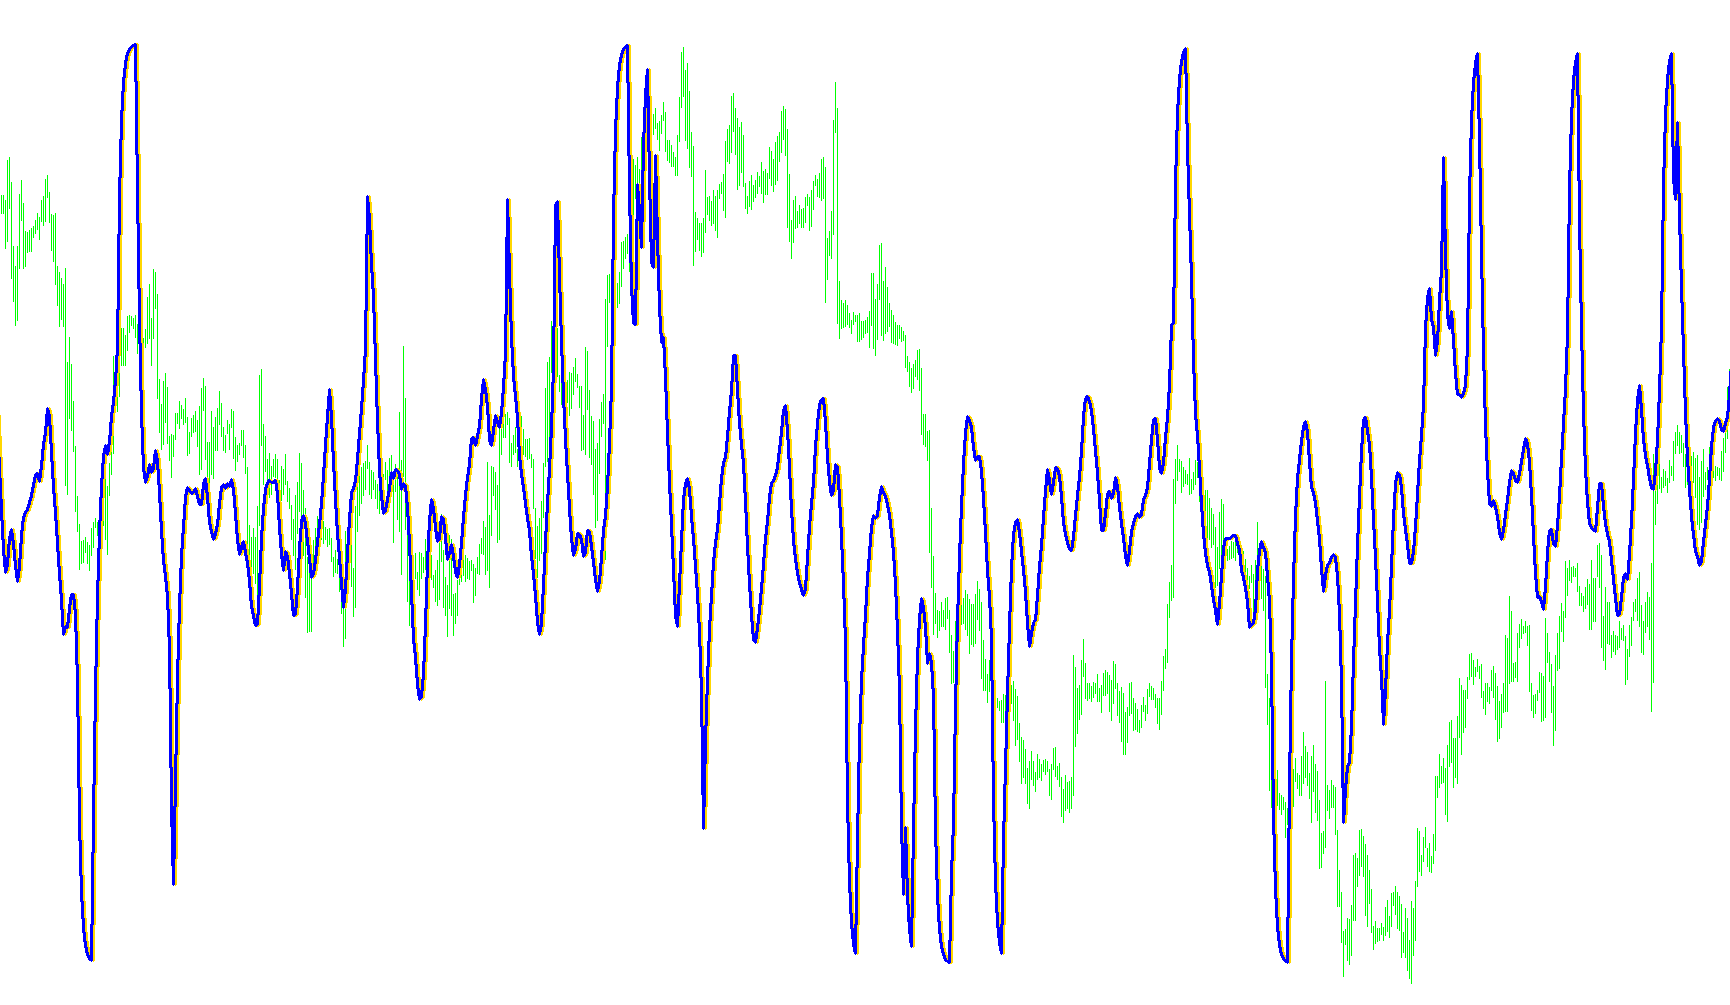
This indicator is designed to help traders identify momentum and potential trend reversals by analyzing price action through a specialized mathematical transformation. Instead of simply looking at raw price changes, it focuses on how the price relates to its recent highs and lows, smoothing out "noise" to provide a clearer picture of market sentiment.
How the Logic Works
1. Identifying Price Boundaries The tool first examines a specific window of recent candles (defined by the "Length" setting). It identifies the highest peak and the lowest valley reached within that timeframe. By establishing these boundaries, the script can determine where the current price sits in relation to the immediate past range.
2. Relative Position Analysis It then calculates a percentage-based value: where is the price currently located between that high and low? For example, if the price is near the top of its recent range, the indicator recognizes strong upward momentum; if it is near the bottom, it senses downward pressure. To ensure this calculation remains stable, the script also incorporates a moving average to smooth out sudden, insignificant price fluctuations.
3. The Fisher Transformation The core of this tool is a multi-step mathematical process that converts these relative price positions into a fluctuating line.
- Smoothing: It takes the current position and blends it with the previous data point, preventing the indicator from jumping erratically.
- Capping: To keep the data meaningful, the script "caps" extreme values, ensuring that the math doesn't break when prices hit absolute extremes.
- Logarithmic Scaling: Finally, it applies a logarithmic transformation. This converts the smoothed price positions into an oscillating value that makes it easier to see when momentum is accelerating or slowing down.
Visual Interpretation for Traders
The script generates two primary visual lines on your chart:
- The Main Fisher Line: This represents the primary momentum of the market. When this line moves upward, it suggests bullish sentiment; downward movement suggests bearish sentiment.
- The Trigger Line: This acts as a secondary signal based on the previous calculation. By comparing the current Fisher value to this trigger line, traders can look for "crosses."
When these two lines cross each other, it often signals a change in momentum, potentially highlighting an entry or exit point where the trend is shifting from one direction to another.
//+------------------------------------------------------------------+
//|                                                Fisher_org_v1.mq4 |
//|                           Copyright © 2006, TrendLaboratory Ltd. |
//|            http://finance.groups.yahoo.com/group/TrendLaboratory |
//|                                       E-mail: igorad2004@list.ru |
//+------------------------------------------------------------------+
#property copyright "Copyright © 2005, TrendLaboratory Ltd."
#property link      "http://finance.groups.yahoo.com/group/TrendLaboratory"

#property indicator_separate_window
#property indicator_buffers 2
#property indicator_color1 LightBlue
#property indicator_color2 Tomato
//---- input parameters
extern int Length=10;
extern int Price=4;
extern int NumBars=0;
//---- buffers
double Buffer[];
double Value [];
double Fisher[];

int init()
  {
  IndicatorBuffers(3);

  SetIndexStyle(0,DRAW_LINE,1,3);
  SetIndexStyle(1,DRAW_LINE,1,3);

  SetIndexBuffer(0,Buffer);
  SetIndexBuffer(1,Fisher);
  SetIndexBuffer(2,Value);

  IndicatorShortName ("FisherTransform(" + Length + "," + Price + ")");
  SetIndexLabel (0, "Fish");
  SetIndexLabel (1, "Trigger");

  SetIndexDrawBegin(0,Length);
  SetIndexDrawBegin(1,Length);

  return(0);
  }


//+------------------------------------------------------------------+
//| Fisher_org_v1                                                         |
//+------------------------------------------------------------------+
int start()
  {
  int shift;

  double smin=0,smax=0;

if (NumBars>0) int NBars=NumBars; else NBars=Bars;

for(shift=NBars;shift>=0;shift--)
   {
   Buffer[shift]=0.0;
   Value [shift]=0.0;
   Fisher[shift]=0.0;
   }

for(shift=NBars-2-Length;shift>=0;shift--)
   {
   smax = High[Highest(NULL,0,MODE_HIGH,Length,shift)];
   smin = Low[Lowest(NULL,0,MODE_LOW,Length,shift)];

   double price = iMA(NULL,0,1,0,0,Price,shift);

   if (smax==smin) smax=smin+Point;

   double wpr=(price-smin)/(smax-smin);

   Value[shift] = (wpr-0.5) + 0.67*Value[shift+1];

   if (Value[shift]> 0.99) Value[shift]= 0.999;
   if (Value[shift]<-0.99) Value[shift]=-0.999;

   Fisher[shift] = 0.5*MathLog((1.0+Value[shift])/(1.0-Value[shift]))+0.5*Fisher[shift+1];
   Buffer[shift] = Fisher [shift+1];

   }
  return(0);
  }
//+------------------------------------------------------------------+
Comments