FisherKus_Star11
Download script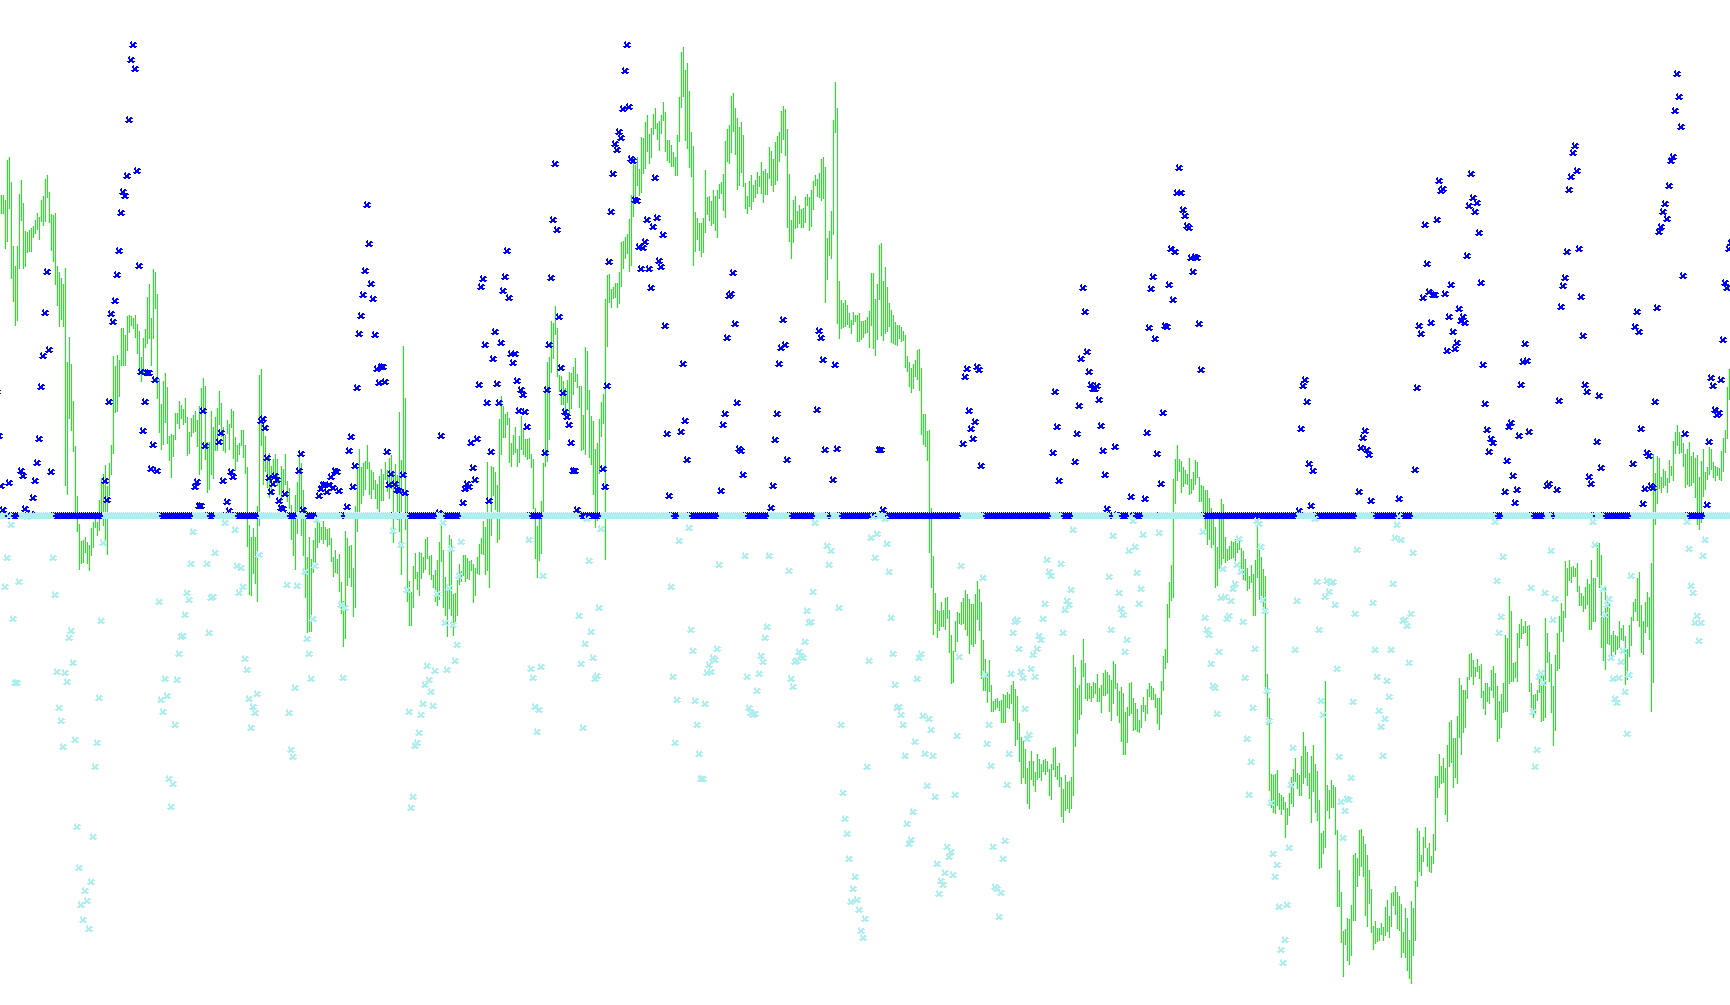
Technical Logic Overview: FisherKus_Star11
The FisherKus_Star11 is a technical analysis tool designed to identify market trends by analyzing price momentum and location. Instead of simply following the raw price movement, this indicator processes data through several layers of calculation—ranging from range detection to logarithmic smoothing—to help traders visualize whether the current trend is moving upward or downward.
Here is a breakdown of the logic used by the script:
1. Price Range Analysis
The indicator begins by looking at a specific window of time (defined by the RangePeriods setting). It identifies the highest high and the lowest low within that period to establish a "trading range." By understanding the boundaries of price action over this timeframe, the script can determine where the current price sits relative to those extremes.
2. Price Location & Normalization
Once the range is established, the script calculates where the current price is located within that range. It converts the price into a normalized value between -1 and +1.
- A value closer to +1 suggests the price is near the top of its recent range.
- A value closer to -1 suggests the price is near the bottom of its recent range.
To prevent erratic jumps in data, this location value is "smoothed" using a specific multiplier (PriceSmoothing). This ensures that minor market flickers do not cause the indicator to react too aggressively.
3. The Fisher Transformation (Logarithmic Scaling)
The core of the script involves a mathematical transformation known as the Fisher Index logic. It takes the smoothed price location and applies a logarithmic calculation: MathLog((1 + Location) / (1 - Location)).
This step is crucial because it transforms the linear price movement into a value that highlights momentum more clearly. It effectively "stretches" the data to make trend changes more visible to the human eye while compressing standard noise.
4. Final Smoothing and Visualization
After the Fisher Index is calculated, the script applies a second layer of smoothing (IndexSmoothing). This final pass ensures the resulting line is fluid and readable on your chart.
The logic then translates these final values into two distinct visual components:
- Bullish Trend: If the final smoothed value is positive (above zero), it is represented by one color (Blue), indicating an upward trend.
- Bearish Trend: If the final smoothed value is negative (below zero), it is represented by another color (Red), indicating a downward trend.
Summary for the User
Essentially, this script looks at how far the price has moved within its recent "territory," applies a mathematical formula to highlight momentum, and then smooths that data out so you can see a clear visual representation of the trend. When the indicator switches colors, it signifies a shift in market momentum from bearish to bullish, or vice versa.
//+------------------------------------------------------------------+
//|                                             FisherKus_Star11.mq4 |
//|                                   Copyright © 23.07.2006 MartinG |
//|                                http://home.arcor.de/cam06/fisher |
//+------------------------------------------------------------------+
#property copyright "Copyright © 23.07.2006 MartinG"
#property link      "http://home.arcor.de/cam06/fisher"

#property indicator_separate_window
//#property indicator_minimum -1
//#property indicator_maximum 1
#property indicator_buffers 3
#property indicator_color2 Blue
#property indicator_color3 Red
//#property indicator_width2 4
//#property indicator_width3 4

int   LeftNum1=56;
int   LeftNum2=56;

extern int     RangePeriods=15;
extern double  PriceSmoothing=0.3;    // =0.67 bei Fisher_m10
extern double  IndexSmoothing=0.3;    // =0.50 bei Fisher_m10
extern int DrawType = 3;
extern int DrawSize = 1;
string         ThisName="FisherKus_Star11";
int            DrawStart;

//---- buffers
double ExtMapBuffer1[];
double ExtMapBuffer2[];
double ExtMapBuffer3[];
double ExtMapBuffer4[];
//+------------------------------------------------------------------+
//| Custom indicator initialization function                         |
//+------------------------------------------------------------------+
int init()
  {
//---- indicators
   IndicatorBuffers(4);

   SetIndexLabel(0,"Fish");
   SetIndexStyle(0,DRAW_NONE);
   SetIndexBuffer(0,ExtMapBuffer1);
   SetIndexStyle(1,DrawType,STYLE_SOLID,DrawSize);
   SetIndexBuffer(1,ExtMapBuffer2);
   SetIndexStyle(2,DrawType,STYLE_SOLID,DrawSize);
   SetIndexBuffer(2,ExtMapBuffer3);
   SetIndexStyle(3,DRAW_NONE);
   SetIndexBuffer(3,ExtMapBuffer4);

   string Text=ThisName;
   Text=Text+"  (rPeriods "+RangePeriods;
   Text=Text+", pSmooth "+DoubleToStr(PriceSmoothing,2);
   Text=Text+", iSmooth "+DoubleToStr(IndexSmoothing,2);
   Text=Text+")  ";
   IndicatorShortName(Text);

   SetIndexLabel(1,NULL);
   SetIndexLabel(2,NULL);


   DrawStart=2*RangePeriods+4;             // DrawStart= BarNumber calculated from left to right
   SetIndexDrawBegin(1,DrawStart);
   SetIndexDrawBegin(2,DrawStart);

   if (PriceSmoothing>=1.0)
      {
      PriceSmoothing=0.9999;
      Alert("Fish61: PriceSmothing factor has to be smaller 1!");
      }
   if (PriceSmoothing<0)
      {
      PriceSmoothing=0;
      Alert("Fish61: PriceSmothing factor mustn''t be negative!");
      }

   if (IndexSmoothing>=1.0)
      {
      IndexSmoothing=0.9999;
      Alert("Fish61: PriceSmothing factor has to be smaller 1!");
      }
   if (IndexSmoothing<0)
      {
      IndexSmoothing=0;
      Alert("Fish61: PriceSmothing factor mustn''t be negative!");
      }

//----
   return(0);
  }
//+------------------------------------------------------------------+
//| Custom indicator deinitialization function                       |
//+------------------------------------------------------------------+
int deinit()
  {
//----

//----
   return(0);
  }
//+------------------------------------------------------------------+
//| Custom indicator iteration function                              |
//+------------------------------------------------------------------+
int start()
  {
   if (Bars<DrawStart)
      {
      Alert("Fish84: Not enough Bars loaded to calculate FisherIndicator with RangePeriods=",RangePeriods);
      return(-1);
      }
//----
   int    counted_bars=IndicatorCounted();
   if (counted_bars<0) return(-1);
   if (counted_bars>0) counted_bars--;
//----
   int Position=Bars-counted_bars;        // Position = BarPosition calculated from right to left
   int LeftNum1=Bars-Position;            // when more bars are loaded the Position of a bar changes but not its LeftNum
   if (LeftNum1<RangePeriods+1)Position=Bars-RangePeriods-1;

   while(Position>=0)
      {
      CalculateCurrentBar(Position);
      Position--;
      }

//----
   return(0);
  }

//+------------------------------------------------------------------+
//| Single Bar Calculation function                                  |
//+------------------------------------------------------------------+
int CalculateCurrentBar(int pos)
  {
   double  LowestLow, HighestHigh, GreatestRange, MidPrice;
   double  PriceLocation, SmoothedLocation, FishIndex, SmoothedFish;
//----
   LowestLow = Low[Lowest(NULL,0,MODE_LOW,RangePeriods,pos)];
   HighestHigh = High[Highest(NULL,0,MODE_HIGH,RangePeriods,pos)];
   if (HighestHigh-LowestLow<0.1*Point)HighestHigh=LowestLow+0.1*Point;
   GreatestRange=HighestHigh-LowestLow;
   MidPrice = (High[pos]+Low[pos])/2;


// PriceLocation in current Range
   if (GreatestRange!=0)
      {
      PriceLocation=(MidPrice-LowestLow)/GreatestRange;
      PriceLocation= 2.0*PriceLocation - 1.0;           // ->  -1 < PriceLocation < +1
      }
// Smoothing of PriceLocation
   ExtMapBuffer4[pos]=PriceSmoothing*ExtMapBuffer4[pos+1]+(1.0-PriceSmoothing)*PriceLocation;
   SmoothedLocation=ExtMapBuffer4[pos];
   if (SmoothedLocation> 0.99) SmoothedLocation= 0.99; // verhindert, dass MathLog unendlich wird
   if (SmoothedLocation<-0.99) SmoothedLocation=-0.99; // verhindert, dass MathLog minuns unendlich wird


// FisherIndex
   if(1-SmoothedLocation!=0) FishIndex=MathLog((1+SmoothedLocation)/(1-SmoothedLocation));
   else Alert("Fisher129: Unerlaubter Zustand bei Bar Nummer ",Bars-pos);

// Smoothing of FisherIndex
   ExtMapBuffer1[pos]=IndexSmoothing*ExtMapBuffer1[pos+1]+(1.0-IndexSmoothing)*FishIndex;
   if (Bars-pos<DrawStart)ExtMapBuffer1[pos]=0;
   SmoothedFish=ExtMapBuffer1[pos];


   if (SmoothedFish>0)     // up trend
      {
      ExtMapBuffer2[pos]=SmoothedFish;
      ExtMapBuffer3[pos]=0;
      }
   else                          // else down trend
      {
      ExtMapBuffer2[pos]=0;
      ExtMapBuffer3[pos]=SmoothedFish;
      }
//----
   return(0);
  }


//+------------------------------------------------------------------+
Comments