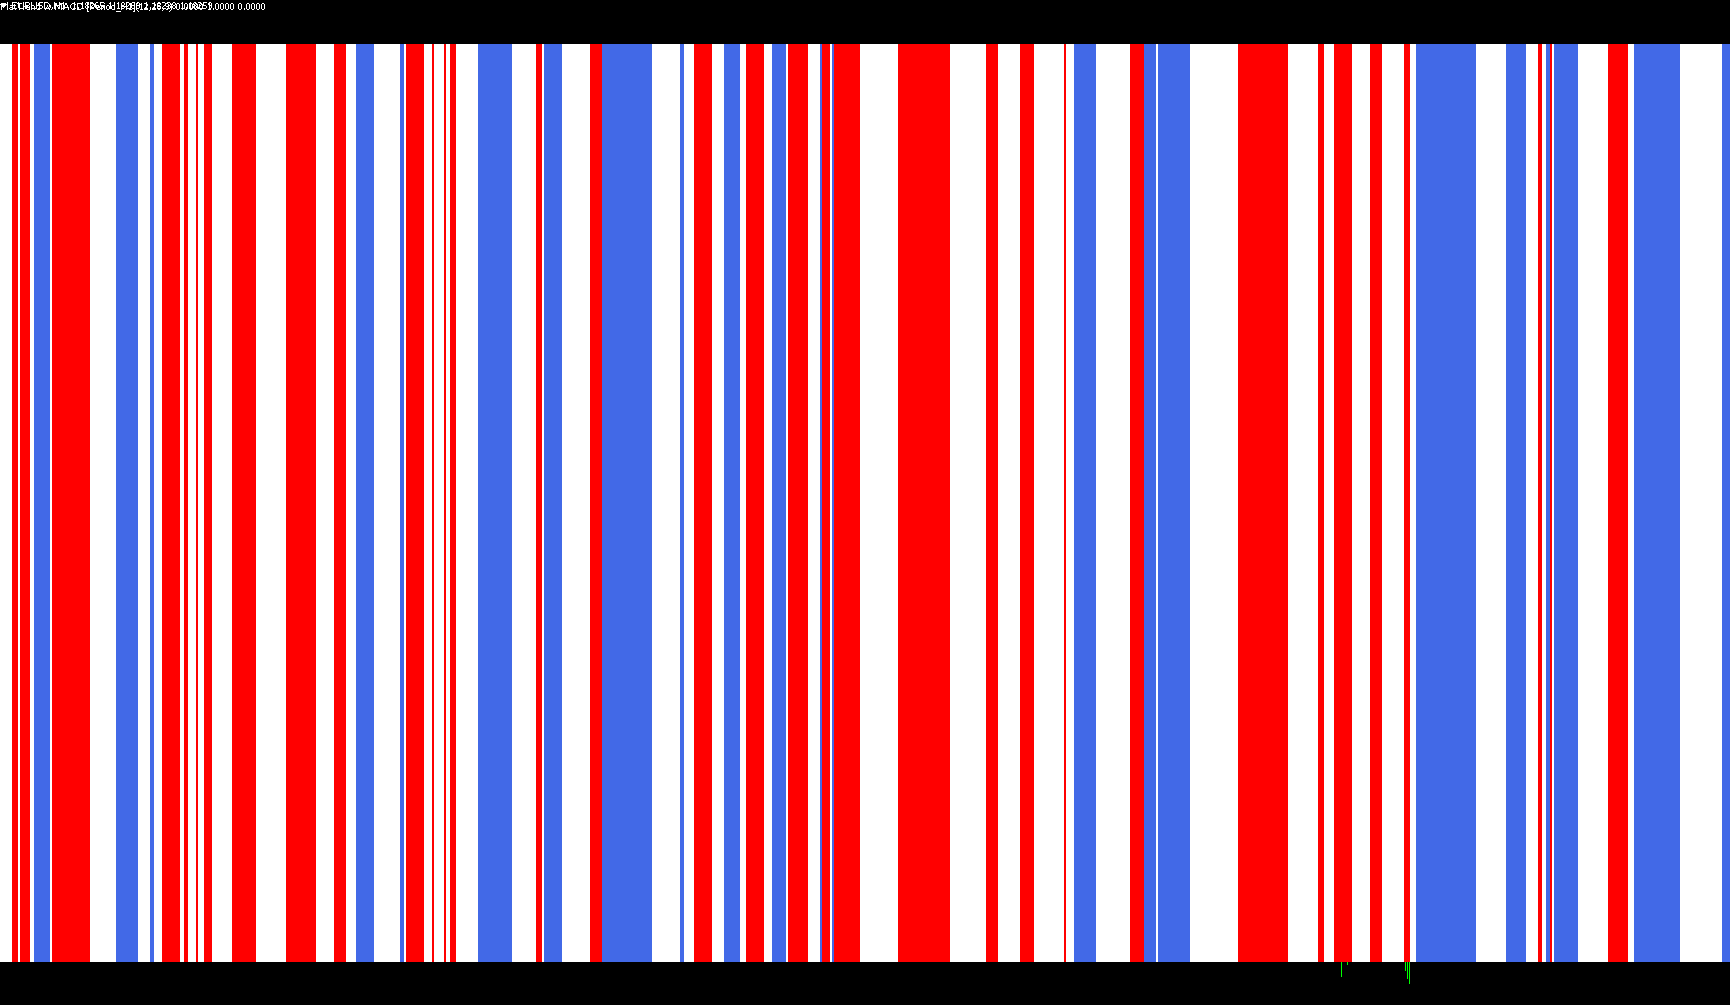
Okay, here's a breakdown of what this MetaTrader script does, explained in a way that avoids technical jargon:
This script is designed to identify potential "flat" or sideways trending periods in a financial market. It does this by analyzing the relationship between two lines derived from a common indicator called MACD (Moving Average Convergence Divergence).
Here's the step-by-step logic:
-
Configuration: The script starts by letting the user customize several settings. The most important are:
- Minutes: This determines the timeframe used for the analysis. The user can choose different timeframes (e.g., 1 minute, 5 minutes, 1 hour, daily, etc.).
- MACD Settings: Three numbers control the calculations within the MACD indicator (Fast, Slow, and MA). These numbers influence how sensitive the MACD indicator is to price changes.
- BarsToCount: Defines how many historical data points (bars) the script will analyze.
- TimeFrames: Shows the different timeframes for the values on Minutes variable.
-
Data Collection: The script collects historical price data for the selected timeframe.
-
MACD Calculation: For each historical data point, the script calculates two lines related to the MACD indicator: the "Main" line and the "Signal" line.
-
Trend Identification: This is the core logic:
- It checks if the MACD "Signal" line is below the MACD "Main" line and if the MACD "Main" is above zero. If both are true, it suggests a possible upward trend.
- It checks if the MACD "Signal" line is above the MACD "Main" line and if the MACD "Main" is below zero. If both are true, it suggests a possible downward trend.
- If neither of the above conditions is met, it flags the data point as a possible "flat" or sideways trend.
-
Visual Representation: The script uses three colored histograms in a separate window to visually represent the potential trend:
- Red: Represents a situation where the MACD indicates a potential downward trend.
- Blue: Represents a situation where the MACD indicates a potential upward trend.
- Gold: Represents a situation where the MACD doesn't clearly indicate an upward or downward trend, suggesting a flat or sideways market.
In essence, the script automates the process of looking for periods where the market isn't clearly trending up or down, using the MACD indicator as its primary tool for analysis. The color-coded histograms make it easy to visually identify these potential flat periods.
//+------------------------------------------------------------------+
//|                                                    FlatTrend.mq4 |
//|                                                       Kirk Sloan |
//|                                        http://www.metaquotes.net |
//+------------------------------------------------------------------+
#property copyright "Kirk Sloan"
#property link      "http://www.metaquotes.net"

#property indicator_separate_window
#property indicator_minimum 0
#property indicator_maximum 1
#property indicator_buffers 3
#property indicator_color1 Red
#property indicator_color2 RoyalBlue
#property indicator_color3 Gold
//---- input parameters
extern int Minutes=0;
extern int MACD_Fast = 12;
extern int MACD_Slow = 26;
extern int MACD_MA = 9;
extern int BarsToCount = 1000;
extern string  TimeFrames = "M1;5,15,30,60H1;240H4;1440D1;10080W1;43200MN|0-CurrentTF";

//---- buffers
double ExtMapBuffer1[];
double ExtMapBuffer2[];
double ExtMapBuffer3[];
double Ma;
double hhigh, llow;
double Psar;
double PADX,NADX;
string TimeFrameStr;
double MA1,MA2,MA3;
double MACD_Signal,MACD_Main;
//+------------------------------------------------------------------+
//| Custom indicator initialization function                         |
//+------------------------------------------------------------------+
int init()
  {
//---- indicators
  SetIndexStyle(0,DRAW_HISTOGRAM,STYLE_SOLID,4,Red);
  SetIndexBuffer(0,ExtMapBuffer1);
  SetIndexStyle(1,DRAW_HISTOGRAM,STYLE_SOLID,4, RoyalBlue);
  SetIndexBuffer(1,ExtMapBuffer2);
  SetIndexStyle(2,DRAW_HISTOGRAM,STYLE_SOLID,4, Gold);
  SetIndexBuffer(2,ExtMapBuffer3);
   if (Minutes<Period()) Minutes=Period();

switch(Minutes)
   {
      case 1 : TimeFrameStr="Period_M1"; break;
      case 5 : TimeFrameStr="Period_M5"; break;
      case 15 : TimeFrameStr="Period_M15"; break;
      case 30 : TimeFrameStr="Period_M30"; break;
      case 60 : TimeFrameStr="Period_H1"; break;
      case 240 : TimeFrameStr="Period_H4"; break;
      case 1440 : TimeFrameStr="Period_D1"; break;
      case 10080 : TimeFrameStr="Period_W1"; break;
      case 43200 : TimeFrameStr="Period_MN1"; break;
      default : TimeFrameStr="Current Timeframe";
   }
   IndicatorShortName("FlatTrend w MACD ["+TimeFrameStr+"]("+MACD_Fast+","+MACD_Slow+","+MACD_MA+")");

//----
   return(0);
  }
//+------------------------------------------------------------------+
//| Custom indicator deinitialization function                       |
//+------------------------------------------------------------------+
int deinit()
  {
//----

//----
   return(0);
  }
//+------------------------------------------------------------------+
//| Custom indicator iteration function                              |
//+------------------------------------------------------------------+
int start()
  {
   datetime TimeArray[];
   int    i,limit,y=0,counted_bars=IndicatorCounted();
//----
   ArrayCopySeries(TimeArray,MODE_TIME,Symbol(),Minutes);

limit=Bars-counted_bars;
limit=MathMax(limit,Minutes/Period());
limit=MathMin(limit,BarsToCount);
for ( y=0,i = 0; i < limit; i++)
{
   if (Time[i]<TimeArray[y]) y++;

   ExtMapBuffer1[i]=0;
   ExtMapBuffer2[i]=0;
   ExtMapBuffer3[i]=0;


   MACD_Signal=iMACD(NULL,Minutes,MACD_Fast,MACD_Slow,MACD_MA,PRICE_CLOSE,MODE_SIGNAL,y);
   MACD_Main  =iMACD(NULL,Minutes,MACD_Fast,MACD_Slow,MACD_MA,PRICE_CLOSE,MODE_MAIN,y);

   if(MACD_Signal < MACD_Main && MACD_Main > 0)ExtMapBuffer2[i] = 1;
   if(MACD_Signal > MACD_Main && MACD_Main < 0)ExtMapBuffer1[i] = 1;
   if(ExtMapBuffer1[i] == 0 && ExtMapBuffer2[i] == 0)
   {ExtMapBuffer3[i] = 1;}

}


//----
   return(0);
  }
//+------------------------------------------------------------------+
Comments