FlatTrend V2_v3
Download script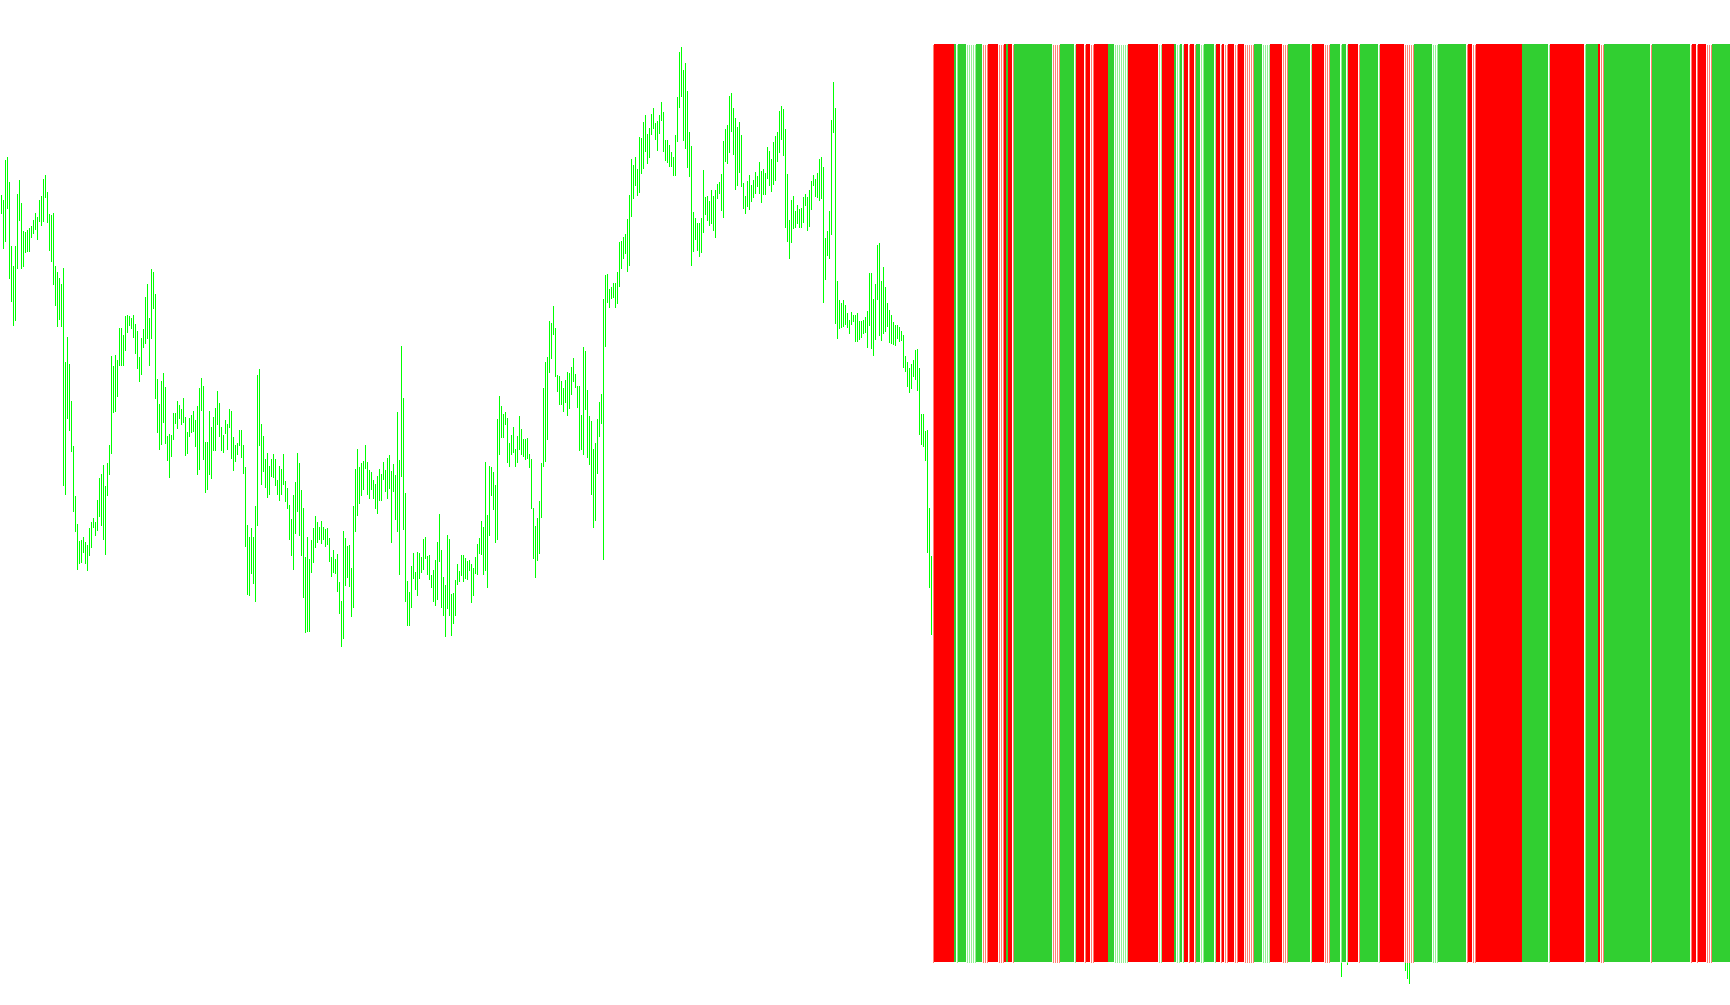
The FlatTrend indicator is designed to provide traders with a visual representation of market momentum and trend direction by combining three distinct technical analysis tools. Instead of cluttering the main price chart, this tool operates in a separate window, using color-coded histograms to signal specific market conditions based on price action, volatility, and trend strength.
Core Logic and Mechanics
The script functions by analyzing historical data over a user-defined timeframe (ranging from 1-minute intervals to monthly views). It processes the market data through three primary lenses:
- Trend Strength (ADX): The tool utilizes the Average Directional Index (ADX) to measure the intensity of a trend. By comparing current values against previous values, the logic determines whether momentum is strengthening or weakening.
- Price Positioning (Parabolic SAR): The script uses the Parabolic SAR indicator to identify potential reversal points and "floor" or "ceiling" levels for price action relative to the current closing price.
- Price Action Context: It constantly monitors the relationship between where the price is currently trading versus these calculated trend and volatility benchmarks.
Visual Signaling
The indicator translates these complex calculations into a four-part histogram system. When specific conditions are met, the script populates different buffers to show:
- Bullish Momentum: Signals when the price is positioned above the reversal markers while the trend strength is actively increasing.
- Bearish Momentum: Signals when the price is positioned below the reversal markers while the trend strength is actively increasing.
- Trend Transitions: The logic identifies unique combinations of price placement and momentum shifts to highlight areas where the market might be stabilizing or shifting its primary direction.
User Experience
By consolidating these three technical methods into one visual tool, the script allows a trader to quickly see "The Big Picture." Rather than looking at multiple separate indicators, a user can glance at the FlatTrend window to identify whether the current market movement is supported by strong momentum or if the price is simply fluctuating in a sideways environment. The use of different colors (Red, Lime Green, Gold, and Light Green) ensures that these distinct market states are easily distinguishable at a glance.
/*-----------------------------+
|			       |
| Shared by www.Aptrafx.com    |
|			       |
+------------------------------*/

//+------------------------------------------------------------------+
//|                                                    FlatTrend.mq4 |
//|                                                       Kirk Sloan |
//|                                        http://www.metaquotes.net |
//+------------------------------------------------------------------+
#property copyright "Kirk Sloan"
#property link      "http://www.metaquotes.net"

#property indicator_separate_window
#property indicator_minimum 0
#property indicator_maximum 1
#property indicator_buffers 4
#property indicator_color1 Red
#property indicator_color2 LimeGreen
#property indicator_color3 Gold
//---- input parameters
extern int       Minutes=5;
//---- buffers
double ExtMapBuffer1[];
double ExtMapBuffer2[];
double ExtMapBuffer3[];
double ExtMapBuffer4[];
double Ma;
double hhigh, llow;
double Psar;
double PADX,NADX;
string TimeFrameStr;
//+------------------------------------------------------------------+
//| Custom indicator initialization function                         |
//+------------------------------------------------------------------+
int init()
  {
//---- indicators
  SetIndexStyle(0,DRAW_HISTOGRAM,STYLE_SOLID,2,Red);
  SetIndexBuffer(0,ExtMapBuffer1);
  SetIndexStyle(1,DRAW_HISTOGRAM,STYLE_SOLID,2, LimeGreen);
  SetIndexBuffer(1,ExtMapBuffer2);
  SetIndexStyle(2,DRAW_HISTOGRAM,STYLE_SOLID,1, Salmon);
  SetIndexBuffer(2,ExtMapBuffer3);
   SetIndexStyle(3,DRAW_HISTOGRAM,STYLE_SOLID,1, LightGreen);
  SetIndexBuffer(3,ExtMapBuffer4);


switch(Minutes)
   {
      case 1 : TimeFrameStr="Period_M1"; break;
      case 5 : TimeFrameStr="Period_M5"; break;
      case 15 : TimeFrameStr="Period_M15"; break;
      case 30 : TimeFrameStr="Period_M30"; break;
      case 60 : TimeFrameStr="Period_H1"; break;
      case 240 : TimeFrameStr="Period_H4"; break;
      case 1440 : TimeFrameStr="Period_D1"; break;
      case 10080 : TimeFrameStr="Period_W1"; break;
      case 43200 : TimeFrameStr="Period_MN1"; break;
      default : TimeFrameStr="Current Timeframe"; Minutes=0;
   }
   IndicatorShortName("Flat Trend ("+TimeFrameStr+")");


//----
   return(0);
  }
//+------------------------------------------------------------------+
//| Custom indicator deinitialization function                       |
//+------------------------------------------------------------------+
int deinit()
  {
//----

//----
   return(0);
  }
//+------------------------------------------------------------------+
//| Custom indicator iteration function                              |
//+------------------------------------------------------------------+
int start()
  {
   int    counted_bars=IndicatorCounted();
//----

for (int i = 0; i < 400; i++){
   ExtMapBuffer1[i]=0;
   ExtMapBuffer2[i]=0;
   ExtMapBuffer3[i]=0;
   ExtMapBuffer4[i]=0;

   PADX=iADX(NULL,Minutes,14 ,PRICE_CLOSE,1,i);
   NADX=iADX(NULL,Minutes,14 ,PRICE_CLOSE,2,i);

   Psar = iSAR(NULL,Minutes,0.02,0.2,i) ;

   if (Psar < iClose(NULL, Minutes,i) && PADX > NADX){
      ExtMapBuffer2[i] = 1;
      }

   if (Psar < iClose(NULL, Minutes,i) && NADX > PADX){
      ExtMapBuffer4[i] = 1;
      }

   if (Psar > iClose(NULL, Minutes,i) && NADX > PADX){
      ExtMapBuffer1[i] = 1;
         }

   if (Psar > iClose(NULL, Minutes,i) && PADX > NADX){
      ExtMapBuffer3[i] = 1;
         }

   if (ExtMapBuffer1[i] == 0 && ExtMapBuffer2[i] == 0){
      //ExtMapBuffer3[i] = 1;
      }

}


//----
   return(0);
  }
//+------------------------------------------------------------------+
Comments