FlatTrend1_v1
Download script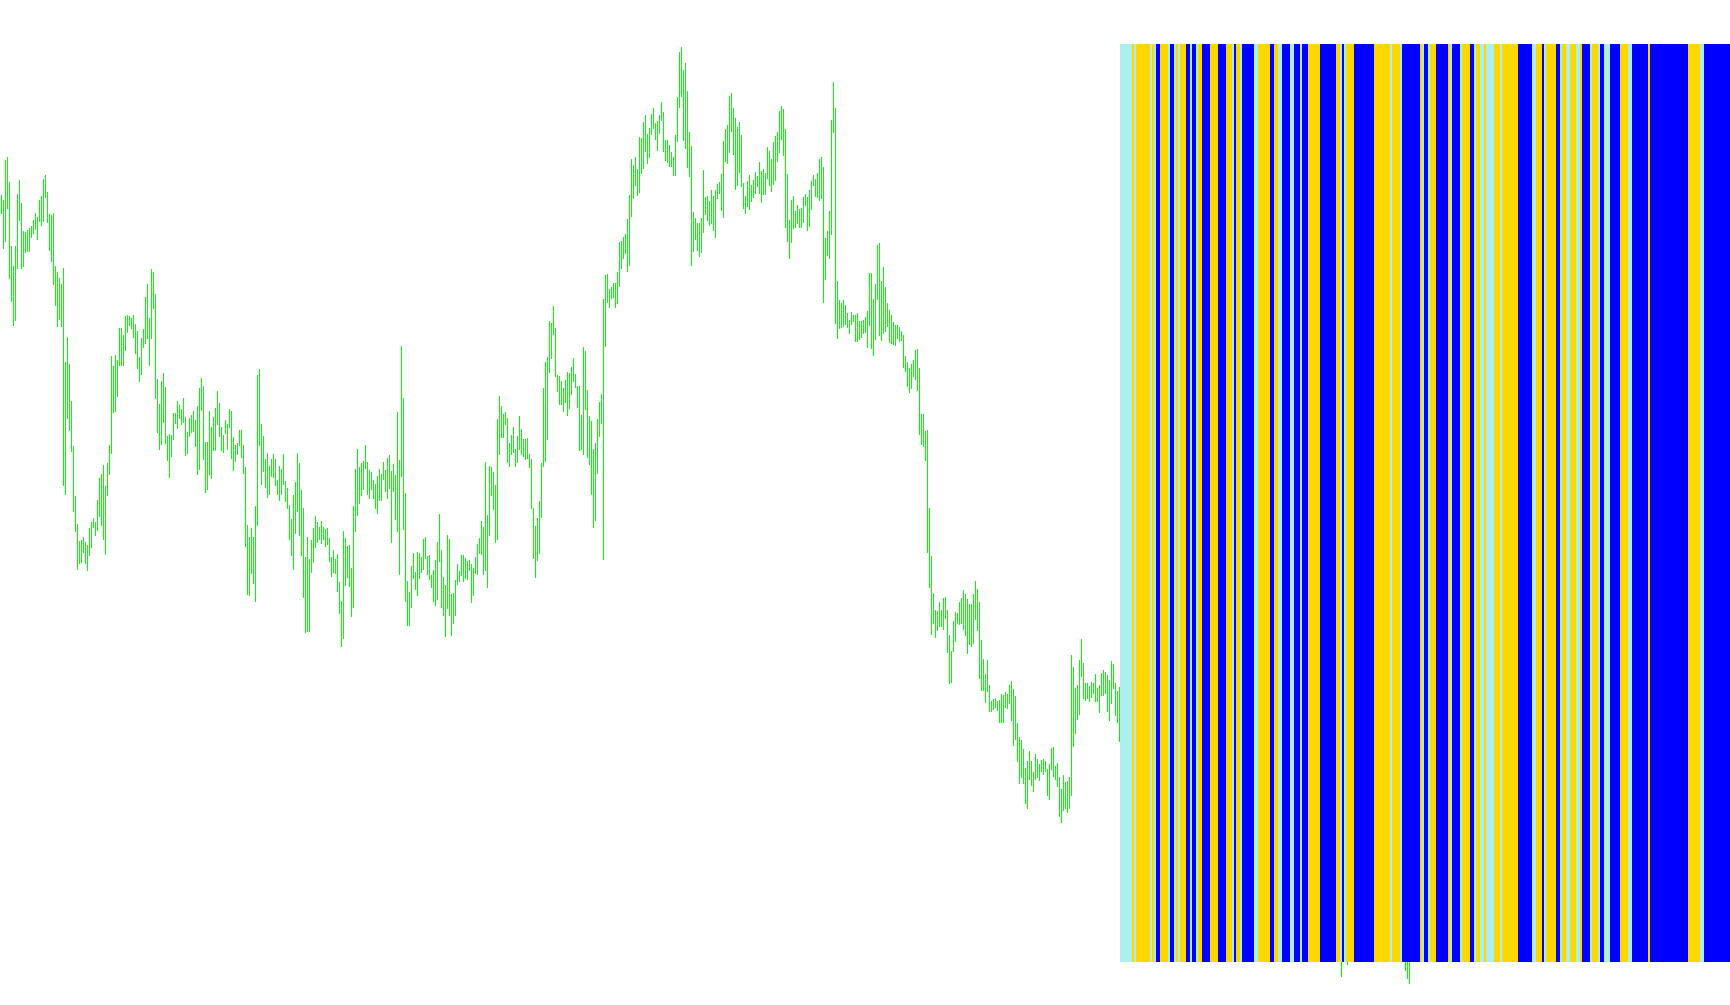
The FlatTrend indicator is designed to provide traders with a clear visual representation of market momentum and trend direction. Rather than cluttering the main price chart, it operates in a separate window, using a three-color histogram system to signal different market conditions: active bullish trends, active bearish trends, and periods of consolidation or "flat" price action.
Core Logic and Mechanics
The tool functions by simultaneously analyzing three distinct technical components to determine the current state of the market:
- Trend Strength (ADX): The script utilizes the Average Directional Index (ADX) to measure the intensity of a trend. It looks for a specific threshold (set at 20) to ensure that the market is moving with enough power to be considered a "trend" rather than just minor noise.
- Price Momentum (SAR): By incorporating the Parabolic SAR, the logic identifies potential reversal points and helps determine if the current price is moving significantly above or below its historical baseline.
- Directional Flow: The script compares current and past ADX values to see if the strength of the move is increasing or decreasing, providing a confirmation of the movement's direction.
How the Signals Work
The indicator categorizes market behavior into three specific visual states:
- Bullish Trend (Green): This signal appears when the price is consistently trading above the Parabolic SAR, the trend strength (ADX) is sufficiently high, and the momentum is moving upward. It suggests a healthy move to the upside.
- Bearish Trend (Red): Conversely, this signal appears when the price falls below the Parabolic SAR while maintaining high trend strength and downward momentum. This indicates a committed move to the downside.
- Flat/Neutral Market (Dark Orange): This is one of the tool's most unique features. If neither a bullish nor a bearish condition is met—meaning the market lacks sufficient strength or clear direction—the indicator displays a "Flat" signal. This alerts the trader that the market is currently in a range-bound state or consolidating, suggesting that trend-following strategies may be less effective at that moment.
Customization and Flexibility
The script allows for easy adjustments to suit different trading styles:
- Timeframe Selection: Users can choose specific intervals (from 1 minute up to monthly charts) to view trends across various horizons.
- Sensitivity Tuning: The parameters for the ADX and Parabolic SAR can be adjusted, allowing traders to make the indicator more "sensitive" to small moves or more "conservative" to filter out market noise.
Price Data Components
Indicators Used
Miscellaneous
11
Views
0
Downloads
0
Favorites
FlatTrend1_v1
/*-----------------------------+
|			       |
| Shared by www.Aptrafx.com    |
|			       |
+------------------------------*/

//+------------------------------------------------------------------+
//|                                                    FlatTrend.mq4 |
//|                                                       Kirk Sloan |
//|                               modified by Ronald Verwer/ROVERCOM |
//+------------------------------------------------------------------+
#property copyright "Kirk Sloan/Ronald Verwer"

#property indicator_separate_window
#property indicator_minimum 0
#property indicator_maximum 1
#property indicator_buffers 3
#property indicator_color1 Red
#property indicator_color2 Green
#property indicator_color3 DarkOrange
#property indicator_width1 2
#property indicator_width2 2
#property indicator_width3 2
//---- input parameters
extern int Minutes=5;
extern int ADX=4;
extern double PSarStep=0.09;
extern double PSarMax=0.5;
//---- buffers
double ExtMapBuffer1[];
double ExtMapBuffer2[];
double ExtMapBuffer3[];
double Ma;
double hhigh, llow;
double Psar;
double AADX,PADX,NADX;
string TimeFrameStr;
//+------------------------------------------------------------------+
//| Custom indicator initialization function                         |
//+------------------------------------------------------------------+
int init()
   {
//---- indicators
   SetIndexStyle(0,DRAW_HISTOGRAM,STYLE_SOLID,2);
   SetIndexBuffer(0,ExtMapBuffer1);
   SetIndexStyle(1,DRAW_HISTOGRAM,STYLE_SOLID,2);
   SetIndexBuffer(1,ExtMapBuffer2);
   SetIndexStyle(2,DRAW_HISTOGRAM,STYLE_SOLID,2);
   SetIndexBuffer(2,ExtMapBuffer3);
   SetIndexLabel(0,NULL);
   SetIndexLabel(1,NULL);
   SetIndexLabel(2,NULL);

   switch(Minutes)
    {
       case 1 : TimeFrameStr="1M"; break;
       case 5 : TimeFrameStr="5M"; break;
       case 15 : TimeFrameStr="15M"; break;
       case 30 : TimeFrameStr="30M"; break;
       case 60 : TimeFrameStr="1H"; break;
       case 240 : TimeFrameStr="4H"; break;
       case 1440 : TimeFrameStr="D"; break;
       case 10080 : TimeFrameStr="W"; break;
       case 43200 : TimeFrameStr="MN"; break;
       default : TimeFrameStr="Current Timeframe"; Minutes=0;
    }
    IndicatorShortName(""+TimeFrameStr+" Trend");
//----
    return(0);
   }
 //+------------------------------------------------------------------+
//| Custom indicator deinitialization function                       |
//+------------------------------------------------------------------+
int deinit()
   {
//----

//----
    return(0);
   }
//+------------------------------------------------------------------+
//| Custom indicator iteration function                              |
//+------------------------------------------------------------------+
int start()
   {
    int    counted_bars=IndicatorCounted();
//----
for (int i = 0; i < 300; i++){
    ExtMapBuffer1[i]=0;
    ExtMapBuffer2[i]=0;
    ExtMapBuffer3[i]=0;

    AADX=iADX(NULL,Minutes,ADX,PRICE_CLOSE,0,i);
    PADX=iADX(NULL,Minutes,ADX,PRICE_CLOSE,1,i);
    NADX=iADX(NULL,Minutes,ADX,PRICE_CLOSE,2,i);

    Psar = iSAR(NULL,Minutes,PSarStep,PSarMax,i) ;

    if (Psar < iClose(NULL, Minutes,i) && PADX > NADX && AADX >= 20){
       ExtMapBuffer2[i] = 1;
       }
    if (Psar > iClose(NULL, Minutes,i) && NADX > PADX && AADX >= 20){
       ExtMapBuffer1[i] = 1;
       }
    if (ExtMapBuffer1[i] == 0 && ExtMapBuffer2[i] == 0){
       ExtMapBuffer3[i] = 1;
       }
   }
//----
   return(0);
   }
//+------------------------------------------------------------------+
Comments