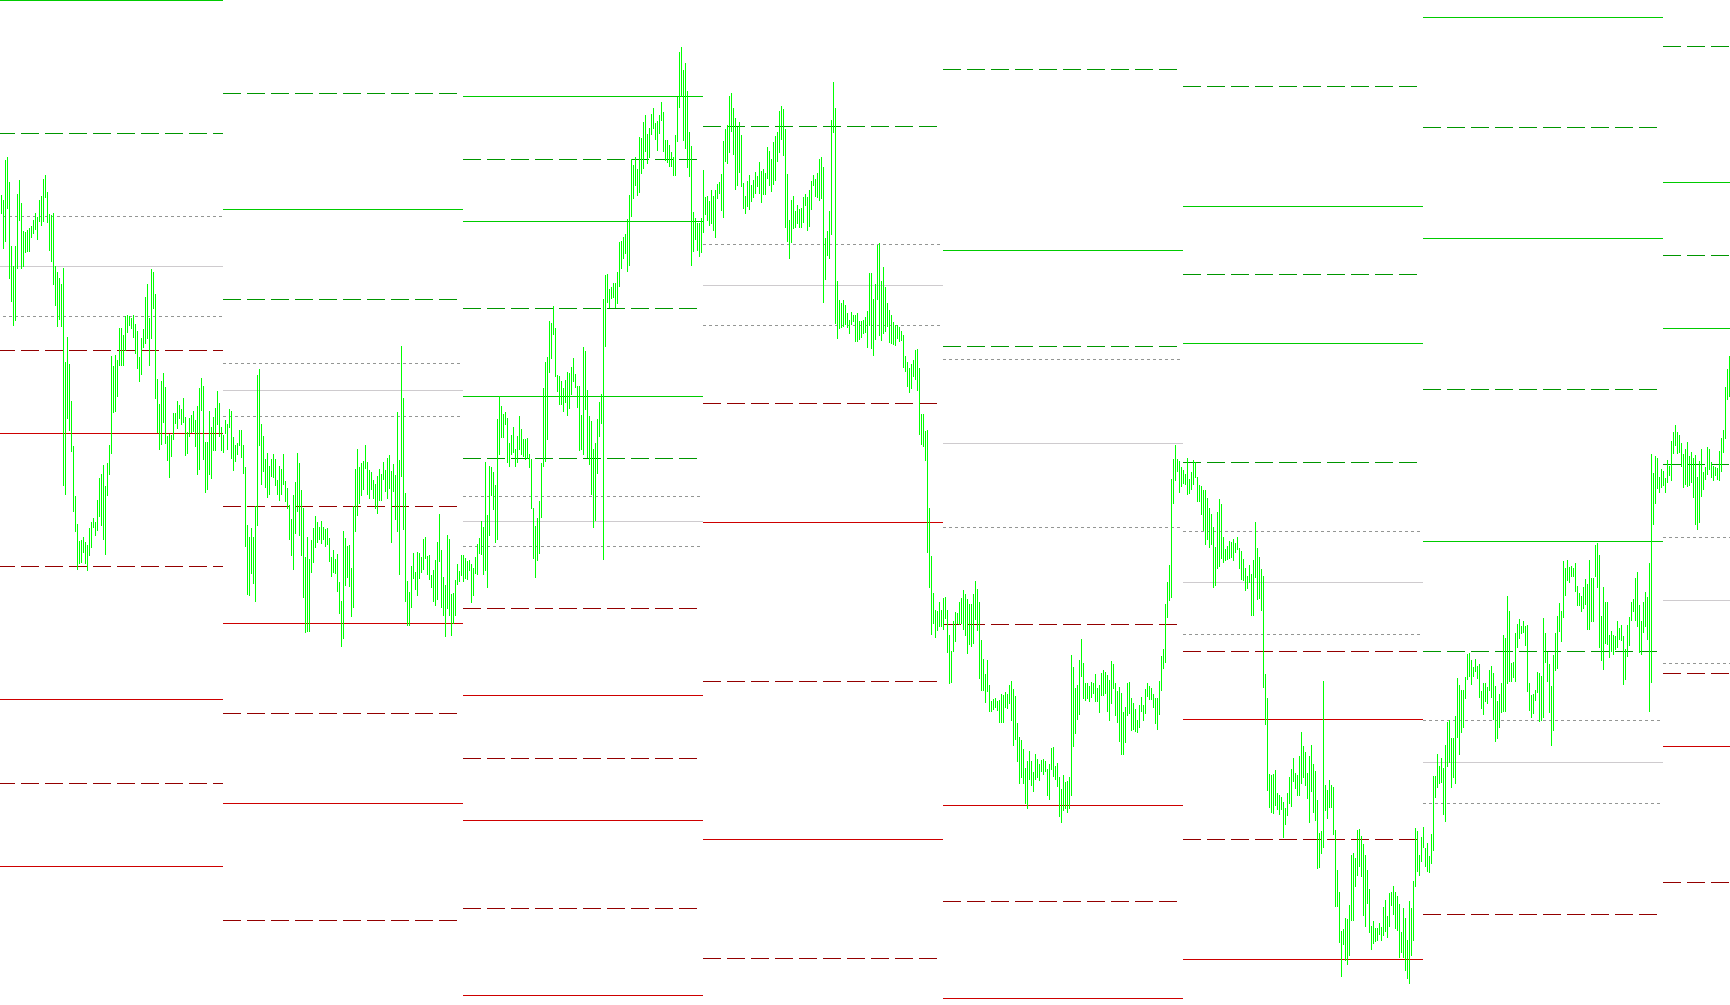
This tool is designed to provide traders with a comprehensive visual map of potential price levels based on "Pivot Points," which are standard technical analysis markers used to identify areas of support and resistance.
Core Functionality
The script automatically calculates and draws various price levels on your chart based on historical data from a specific timeframe that you choose (such as Hourly, Daily, Weekly, or Monthly). Instead of just showing one price point, it generates a full "floor" of levels to help you see where the market might react, stall, or reverse.
How the Logic Works
The tool looks at the previous completed candle for your selected timeframe and uses its High, Low, Open, and Close prices to calculate several distinct types of data:
- Primary Pivot Point (PP): This is the central baseline calculated from the average of the previous period's price action. It acts as the "anchor" for all other levels.
- Support and Resistance Levels: The script calculates three primary levels above the pivot (Resistance) and three levels below (Support). These are key zones where sellers often step in to push prices down or buyers step in to push prices up.
- Price Range Boundaries: It identifies the upper and lower boundaries of the price movement, providing a visual "envelope" of the expected trading range.
- Mid-Levels: To give you even more precision, the script calculates several "Middle" levels between the primary supports and resistances. These help identify smaller fluctuations within the larger trend.
Key Features for Users
- Multi-Timeframe Analysis: You can switch the calculation source easily (e.g., seeing Daily pivots while trading on a 15-minute chart) to understand the "big picture" of the market.
- Customizable Visibility: The tool includes settings that allow you to turn specific types of lines on or off. You can choose to see just the main pivots, only the range boundaries, or all the middle levels depending on how much detail you prefer on your screen.
- Historical Perspective: You can set the tool to display a specific number of past periods (e.g., the last 10 days or weeks), allowing you to see how these levels have behaved over time rather than just looking at the current day.
Visual Presentation
The script distinguishes different types of levels using various colors and line styles. This ensures that your chart remains readable, clearly separating the primary support zones from the resistance zones and the intermediate middle points.
//+------------------------------------------------------------------+
//|                                             Floor_Pivots_MTF.mq4 |
//|                         Written by IgorAD,igorad2003@yahoo.co.uk |
//|                            Modified by Kris, kris.pivo@gmail.com |
//+------------------------------------------------------------------+
#property indicator_chart_window
#property indicator_buffers   4
#property indicator_color1    C'200,200,200' // Pivot
#property indicator_color2    C'150,150,150' // Pivot Range
#property indicator_color3    C'000,200,000' // Resistance
#property indicator_color4    C'200,000,000' // Support
#property indicator_color5    C'000,150,000' // Mid-Resistance
#property indicator_color6    C'150,000,000' // Mid-Support

extern int     CountPeriods   = 10;
extern string  Time_Period     = "W1";  //H1, H4, D1, W1, MN
extern bool    Plot_Pivots    = true;
extern bool    Plot_Range     = true;
extern bool    Plot_Middle    = true;

   datetime time1;
   datetime time2;
   double open,close,high,low;
   double PP,R1,R2,R3,S1,S2,S3,M0,M1,M2,M3,M4,M5;
   double PD, PH, PL;
   double pstyle, rstyle, mstyle;
   int shift, num, period;

   void ObjDel()
   {
      for (;num<=CountPeriods;num++)
      {
      ObjectDelete("PP["+num+"]");
      ObjectDelete("R1["+num+"]");
      ObjectDelete("R2["+num+"]");
      ObjectDelete("R3["+num+"]");
      ObjectDelete("S1["+num+"]");
      ObjectDelete("S2["+num+"]");
      ObjectDelete("S3["+num+"]");

      ObjectDelete("PRH["+num+"]");
      ObjectDelete("PRL["+num+"]");

      ObjectDelete("M0["+num+"]");
      ObjectDelete("M1["+num+"]");
      ObjectDelete("M2["+num+"]");
      ObjectDelete("M3["+num+"]");
      ObjectDelete("M4["+num+"]");
      ObjectDelete("M5["+num+"]");
      }
   }

   void PlotLine(string name,double value,double line_color,double style)
   {
   ObjectCreate(name,OBJ_TREND,0,time1,value,time2,value);
   ObjectSet(name, OBJPROP_WIDTH, 1);
   ObjectSet(name, OBJPROP_STYLE, style);
   ObjectSet(name, OBJPROP_RAY, false);
   ObjectSet(name, OBJPROP_BACK, true);
   ObjectSet(name, OBJPROP_COLOR, line_color);
    }
int init()
  {
   if (Time_Period=="H1" || Time_Period=="60") period=PERIOD_H1;
   else
   if (Time_Period=="H4" || Time_Period=="240") period=PERIOD_H4;
   else
   if (Time_Period=="D1" || Time_Period=="1440") period=PERIOD_D1;
   else
   if (Time_Period=="W1" || Time_Period=="10080") period=PERIOD_W1;
   else
   if (Time_Period=="MN" || Time_Period=="43200") period=PERIOD_MN1;
   else
   {
   Comment("Wrong TimePeriod. Must be H1, H4, D1, W1 or MN");
   return(0);
   }
  return(0);
  }


int deinit()
  {
   ObjDel();
   Comment("");
   return(0);
  }

int start()
  {
  int i;

  ObjDel();
  num=0;

  for (shift=CountPeriods-1;shift>=0;shift--)
  {
  time1=iTime(NULL,period,shift);

  high  = iHigh(NULL,period,shift+1);
  low   = iLow(NULL,period,shift+1);
  open  = iOpen(NULL,period,shift+1);
  close = iClose(NULL,period,shift+1);

  PP  = (high+low+close)/3;

  PD = MathAbs(((high + low)/2) - PP);
  PH = PP + PD;
  PL = PP - PD;

  R1 = 2*PP-low;
  R2 = PP+(high - low);
  R3 = (2*PP)+(high-(2*low));

  S1 = 2*PP-high;
  S2 = PP-(high - low);
  S3 = (2*PP)-((2*high)-low);

  M0 = 0.5*(S2+S3);
  M1 = 0.5*(S1+S2);
  M2 = 0.5*(PP+S1);
  M3 = 0.5*(PP+R1);
  M4 = 0.5*(R1+R2);
  M5 = 0.5*(R2+R3);

  time2=time1+period*60;

  pstyle=0;
  rstyle=2;
  mstyle=1;
  num=shift;

  PlotLine("PP["+num+"]",PP,indicator_color1,pstyle);

  if(Plot_Pivots)
  {
   PlotLine("R1["+num+"]",R1,indicator_color3,pstyle);
   PlotLine("R2["+num+"]",R2,indicator_color3,pstyle);
   PlotLine("R3["+num+"]",R3,indicator_color3,pstyle);

   PlotLine("S1["+num+"]",S1,indicator_color4,pstyle);
   PlotLine("S2["+num+"]",S2,indicator_color4,pstyle);
   PlotLine("S3["+num+"]",S3,indicator_color4,pstyle);
  }
  if(Plot_Range)
  {
   PlotLine("PRH["+num+"]",PH,indicator_color2,rstyle);
   PlotLine("PRL["+num+"]",PL,indicator_color2,rstyle);
  }
  if(Plot_Middle)
  {
   PlotLine("M0["+num+"]",M0,indicator_color6,mstyle);
   PlotLine("M1["+num+"]",M1,indicator_color6,mstyle);
   PlotLine("M2["+num+"]",M2,indicator_color6,mstyle);
   PlotLine("M3["+num+"]",M3,indicator_color5,mstyle);
   PlotLine("M4["+num+"]",M4,indicator_color5,mstyle);
   PlotLine("M5["+num+"]",M5,indicator_color5,mstyle);
  }
  }
   return(0);
  }
//+---------------------------------------------------------------------------------------+
//|                                        THE END                                        |
//+---------------------------------------------------------------------------------------+
Comments