Forex Trend fxfariz_v1
Download script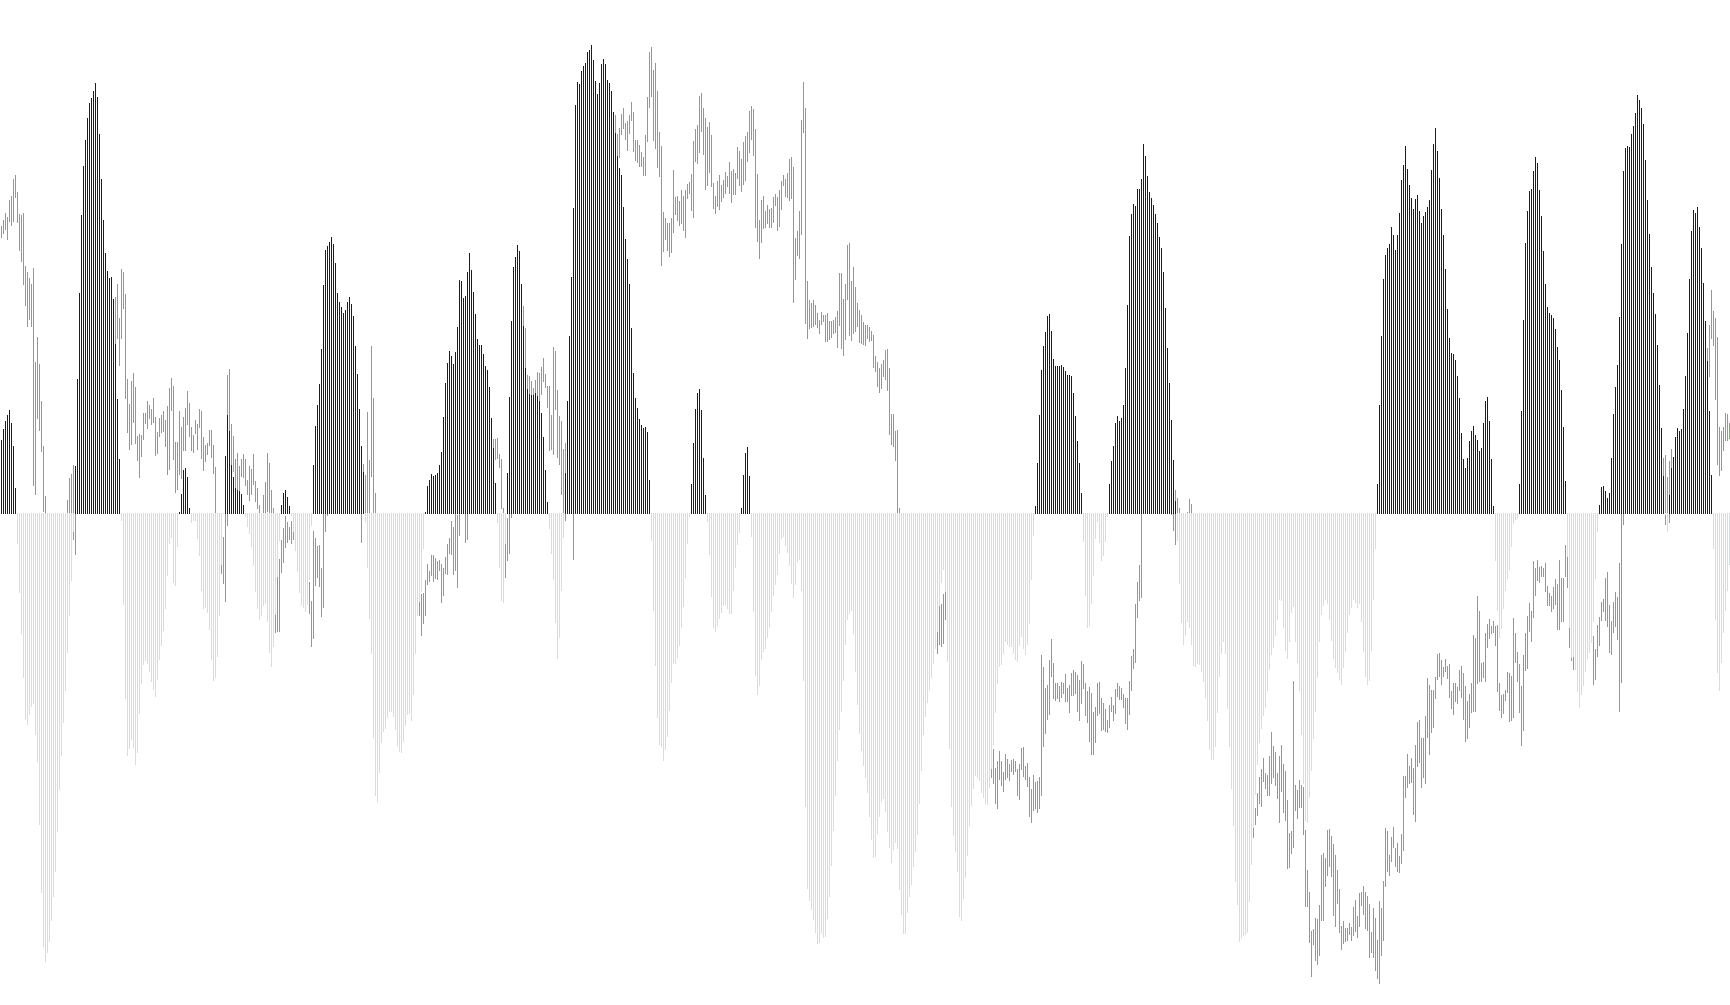
This tool is designed as a visual aid for traders who specialize in "scalping"—a trading strategy that focuses on capturing small price movements over very short periods. The primary purpose of this script is to analyze recent market price action to determine the overall trend direction, helping users identify whether the momentum is currently shifting toward the upside or the downside.
Core Logic and Mechanics
The script functions by analyzing a specific "look-back" window (the number of previous candles) to calculate the relationship between the highest and lowest prices reached during that timeframe. By evaluating where the current price sits within those highs and lows, the tool generates a smoothed value that represents market sentiment.
Rather than reacting instantly to every small flicker in price, the logic uses a mathematical smoothing technique. This ensures that the resulting trend line is less "noisy" and provides a clearer picture of the underlying market flow. It essentially calculates a weighted average of price movement to distinguish between temporary volatility and actual trend changes.
Visual Indicators
The script translates these complex calculations into a simple visual representation on your chart:
- Trend Identification: It creates a distinct visual output (a histogram) that shifts based on the calculated momentum.
- Directional Cues: When the smoothed data moves above a certain threshold, it signifies an upward trend (Bullish). When it drops below that threshold, it indicates a downward trend (Bearish).
- Dynamic Switching: The tool is programmed to recognize the exact moment the market flips from one state to another, effectively "filtering" out minor fluctuations so you can focus on significant shifts.
Automated Alerts
To ensure traders don't have to watch the screen constantly, the script includes an integrated notification system. When the logic detects a definitive change in the trend—specifically when the momentum crosses from positive to negative (or vice versa)—it triggers a real-time alert. This allows you to react immediately to new opportunities as they develop on the 5-minute chart or whichever timeframe you choose to monitor.
Summary for the Trader
In plain terms, this tool acts as a trend filter. It looks at the recent past, calculates the current "mood" of the market price relative to its recent highs and lows, and provides a clear visual signal (plus an audible alert) when that mood changes. It is designed to help you stay on the right side of the market flow during fast-paced trading sessions.
//+------------------------------------------------------------------+
//|                                           fxfariz_scalpingM5.mq4 |
//|                                     fxfariz a.k.a warrior trader |
//|                                                fxfariz@gmail,com |
//+------------------------------------------------------------------+
#property copyright "fxfariz a.k.a warrior trader"
#property link      "fxfariz@gmail,com"

#property  indicator_separate_window
#property  indicator_buffers 3
#property  indicator_color2  Aqua
#property  indicator_color3  Red
#property indicator_style2 STYLE_SOLID
#property indicator_style3 STYLE_SOLID
#property indicator_width2 2
#property indicator_width3 2

extern int  period=23;
extern bool alarm=true;

double         ExtBuffer0[];
double         ExtBuffer1[];
double         ExtBuffer2[];
double alertBar;
double last;

int init()
  {

   SetIndexStyle(0,DRAW_NONE);
   SetIndexStyle(1,DRAW_HISTOGRAM);
   SetIndexStyle(2,DRAW_HISTOGRAM);
   IndicatorDigits(Digits+1);

   SetIndexBuffer(0,ExtBuffer0);
   SetIndexBuffer(1,ExtBuffer1);
   SetIndexBuffer(2,ExtBuffer2);

   IndicatorShortName("Technique Scalping_TF5M by fxfariz");
   SetIndexLabel(1,NULL);
   SetIndexLabel(2,NULL);

   return(0);
  }


int start()
  {
   //int     period=10;
   int    limit;
   int    counted_bars=IndicatorCounted();
   double prev,current,old;
   double Value=0,Value1=0,Value2=0,Fish=0,Fish1=0,Fish2=0;
   double price;
   double MinL=0;
   double MaxH=0;


   if(counted_bars>0) counted_bars--;
   limit=Bars-counted_bars;


   for(int i=0; i<Bars; i++)
    {
      MaxH = High[Highest(NULL,0,MODE_HIGH,period,i)];
      MinL = Low[Lowest(NULL,0,MODE_LOW,period,i)];
      price = (High[i]+Low[i])/2;

      if(MaxH-MinL == 0) Value = 0.33*2*(0-0.5) + 0.67*Value1;
      else Value = 0.33*2*((price-MinL)/(MaxH-MinL)-0.5) + 0.67*Value1;

      Value=MathMin(MathMax(Value,-0.999),0.999);

      if(1-Value == 0) ExtBuffer0[i]=0.5+0.5*Fish1;
      else ExtBuffer0[i]=0.5*MathLog((1+Value)/(1-Value))+0.5*Fish1;

      Value1=Value;
      Fish1=ExtBuffer0[i];
    }


   bool up=true;
   for(i=Bars; i>=0; i--)
     {
      current=ExtBuffer0[i];
      prev=ExtBuffer0[i+1];

      if (((current<0)&&(prev>0))||(current<0))   up= false;

      if (((current>0)&&(prev<0))||(current>0))   up= true;


      if(!up)
      {
         ExtBuffer2[i]=current;
         ExtBuffer1[i]=0.0;
        if (alarm && i==0 && last != 2 && ExtBuffer1[i] == 0 && Bars>alertBar)
        {
            Alert("ForexTrend Changing Down on ",Period()," ",Symbol());
            alertBar = Bars;last = 2;
        }
       }

       else
       {
         ExtBuffer1[i]=current;
          ExtBuffer2[i]=0.0;
        if (alarm && i==0 && last != 1 && ExtBuffer2[i] == 0 && Bars>alertBar)
        {
            Alert("ForexTrend Changing Up on ",Period()," ",Symbol());
            alertBar = Bars;
            last = 1;
        }
       }
     }

   return(0);
  }
Comments