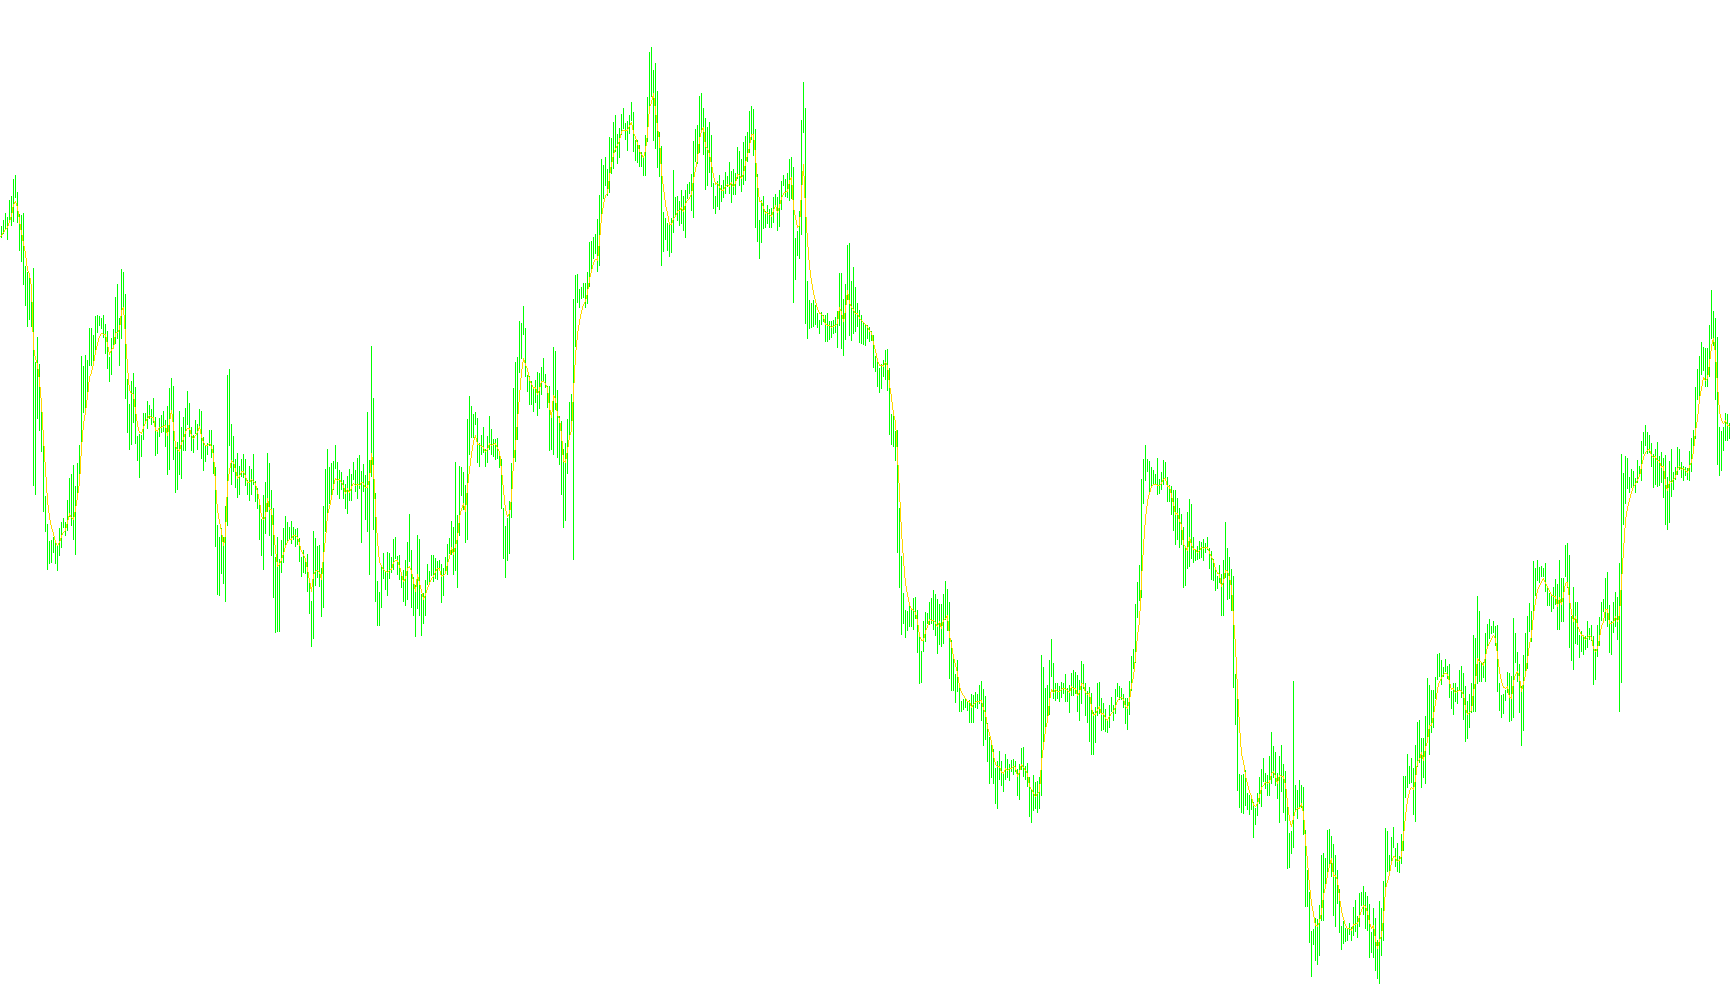
This tool is designed for traders who use Moving Averages to identify trends and price momentum on their charts. It provides a comprehensive visual display of four distinct moving averages simultaneously, allowing you to see multiple layers of market history at once.
Core Functionality
The script calculates four independent moving average lines. Each line can be customized with its own specific settings, meaning you are not limited to one type of calculation. You can mix and match different periods, smoothing methods, and price sources for each of the four lines to create a personalized trading environment.
Key Features
1. Versatile Moving Average Types The indicator supports several standard mathematical models used in technical analysis:
- Simple Moving Average (SMA)
- Exponential Moving Average (EMA)
- Smoothed Moving Average (SMMA)
- Linear Weighted Moving Average (LWMA)
- Least Squares Moving Average (LSMA)
2. Dynamic Price Source Selection Rather than relying solely on the closing price of a candle, this script allows you to choose which specific price data point should be used for each moving average calculation. You can select from:
- Open, High, or Low prices
- The Median (Average of High and Low)
- The Typical Price (Average of High, Low, and Close)
- The Weighted Price (A customized balance of the candle's range and closing price)
3. Custom Sensitivity and Smoothing Each of the four lines can be set to a different "Period." This allows you to view various timeframes at once—for example, you might use a short-term moving average to capture quick price fluctuations and a long-term moving average to identify the primary market trend.
How It Works Visually
When applied to a chart, the script generates four colored lines (Red, Green, Yellow, and Aqua). By observing how these lines interact—such as when they cross each other or move in different directions—traders can gain insights into potential support levels, resistance zones, and changes in market sentiment.
In summary, this script serves as a multi-layered trend analysis tool that offers high flexibility, giving users the ability to customize exactly how price data is smoothed and displayed on their trading screen.
/*-----------------------------+
|			       |
| Shared by www.Aptrafx.com    |
|			       |
+------------------------------*/

//+------------------------------------------------------------------+
//|                                                  Four_MA_Ind.mq4 |
//|                                    Copyright © 2006, Robert Hill |
//| Written by Robert Hill with addition of LSMA MA_Mode 4           |
//+------------------------------------------------------------------+

#property copyright "Copyright © 2006, Robert Hill)"

#property indicator_chart_window
#property  indicator_buffers 4
#property  indicator_color1  Red
#property  indicator_color2  Green
#property  indicator_color3  Yellow
#property  indicator_color4  Aqua
#property  indicator_width1  1
#property  indicator_width2  1
#property  indicator_width3  1
#property  indicator_width4  1


extern int MA_Period1 =   5;
extern int MA_Mode1 = 1; //0=sma, 1=ema, 2=smma, 3=lwma, 4=lsma
extern int PriceMode1 = 0;//0=close, 1=open, 2=high, 3=low, 4=median(high+low)/2, 5=typical(high+low+close)/3, 6=weighted(high+low+close+close)/4

extern int MA_Period2 =   10;
extern int MA_Mode2 = 1; //0=sma, 1=ema, 2=smma, 3=lwma, 4=lsma
extern int PriceMode2 = 0;//0=close, 1=open, 2=high, 3=low, 4=median(high+low)/2, 5=typical(high+low+close)/3, 6=weighted(high+low+close+close)/4

extern int MA_Period3 =   20;
extern int MA_Mode3 = 1; //0=sma, 1=ema, 2=smma, 3=lwma, 4=lsma
extern int PriceMode3 = 0;//0=close, 1=open, 2=high, 3=low, 4=median(high+low)/2, 5=typical(high+low+close)/3, 6=weighted(high+low+close+close)/4

extern int MA_Period4 =   30;
extern int MA_Mode4 = 1; //0=sma, 1=ema, 2=smma, 3=lwma, 4=lsma
extern int PriceMode4 = 0;//0=close, 1=open, 2=high, 3=low, 4=median(high+low)/2, 5=typical(high+low+close)/3, 6=weighted(high+low+close+close)/4
double MA1[];
double MA2[];
double MA3[];
double MA4[];
//+------------------------------------------------------------------+
//| Custom indicator initialization function                         |
//+------------------------------------------------------------------+
int init()
  {
//---- drawing settings
   SetIndexStyle(0,DRAW_LINE);
   SetIndexStyle(1,DRAW_LINE);
   SetIndexStyle(2,DRAW_LINE);
   SetIndexStyle(3,DRAW_LINE);
   SetIndexDrawBegin(0,MA_Period4);
   IndicatorDigits(MarketInfo(Symbol(),MODE_DIGITS)+2);

//---- 3 indicator buffers mapping
   if(!SetIndexBuffer(0,MA1) &&
      !SetIndexBuffer(1,MA2) &&
      !SetIndexBuffer(2,MA3) &&
      !SetIndexBuffer(3,MA4))
      Print("cannot set indicator buffers!");
//---- initialization done

//----
   return(0);
  }
//+------------------------------------------------------------------+
//| Custom indicator deinitialization function                       |
//+------------------------------------------------------------------+
int deinit()
  {
//----

//----
   return(0);
  }

//+------------------------------------------------------------------+
//| LSMA with PriceMode                                              |
//| PrMode  0=close, 1=open, 2=high, 3=low, 4=median(high+low)/2,    |
//| 5=typical(high+low+close)/3, 6=weighted(high+low+close+close)/4  |
//+------------------------------------------------------------------+

double LSMA(int Rperiod, int prMode, int shift)
{
   int i;
   double sum, pr;
   int length;
   double lengthvar;
   double tmp;
   double wt;

   length = Rperiod;

   sum = 0;
   for(i = length; i >= 1  ; i--)
   {
     lengthvar = length + 1;
     lengthvar /= 3;
     tmp = 0;
     switch (prMode)
     {
     case 0: pr = Close[length-i+shift];break;
     case 1: pr = Open[length-i+shift];break;
     case 2: pr = High[length-i+shift];break;
     case 3: pr = Low[length-i+shift];break;
     case 4: pr = (High[length-i+shift] + Low[length-i+shift])/2;break;
     case 5: pr = (High[length-i+shift] + Low[length-i+shift] + Close[length-i+shift])/3;break;
     case 6: pr = (High[length-i+shift] + Low[length-i+shift] + Close[length-i+shift] + Close[length-i+shift])/4;break;
     }
     tmp = ( i - lengthvar)*pr;
     sum+=tmp;
    }
    wt = sum*6/(length*(length+1));

    return(wt);
}


//+------------------------------------------------------------------+
//| Custom indicator iteration function                              |
//+------------------------------------------------------------------+
int start() {
   int limit, i;
   int counted_bars=IndicatorCounted();
//---- check for possible errors
   if(counted_bars<0) return(-1);
//---- last counted bar will be recounted
   if(counted_bars>0) counted_bars--;

   limit=Bars-counted_bars;

   for(i = 0; i <= limit; i++) {
      if (MA_Mode1 == 4)
      {
         MA1[i] = LSMA(MA_Period1, PriceMode1, i);

      }
      else
      {
         MA1[i] = iMA(NULL, 0, MA_Period1, 0, MA_Mode1, PriceMode1, i);
      }

      if (MA_Mode2 == 4)
      {
         MA2[i] = LSMA(MA_Period2, PriceMode2, i);

      }
      else
      {
         MA2[i] = iMA(NULL, 0, MA_Period2, 0, MA_Mode2, PriceMode2, i);
      }
      if (MA_Mode3 == 4)
      {
         MA3[i] = LSMA(MA_Period3, PriceMode3, i);

      }
      else
      {
         MA3[i] = iMA(NULL, 0, MA_Period3, 0, MA_Mode3, PriceMode3, i);
      }
      if (MA_Mode4 == 4)
      {
         MA4[i] = LSMA(MA_Period4, PriceMode4, i);

      }
      else
      {
         MA4[i] = iMA(NULL, 0, MA_Period4, 0, MA_Mode4, PriceMode4, i);
      }

   }

   return(0);
}
Comments