Fractal ZigZag_v2
Download script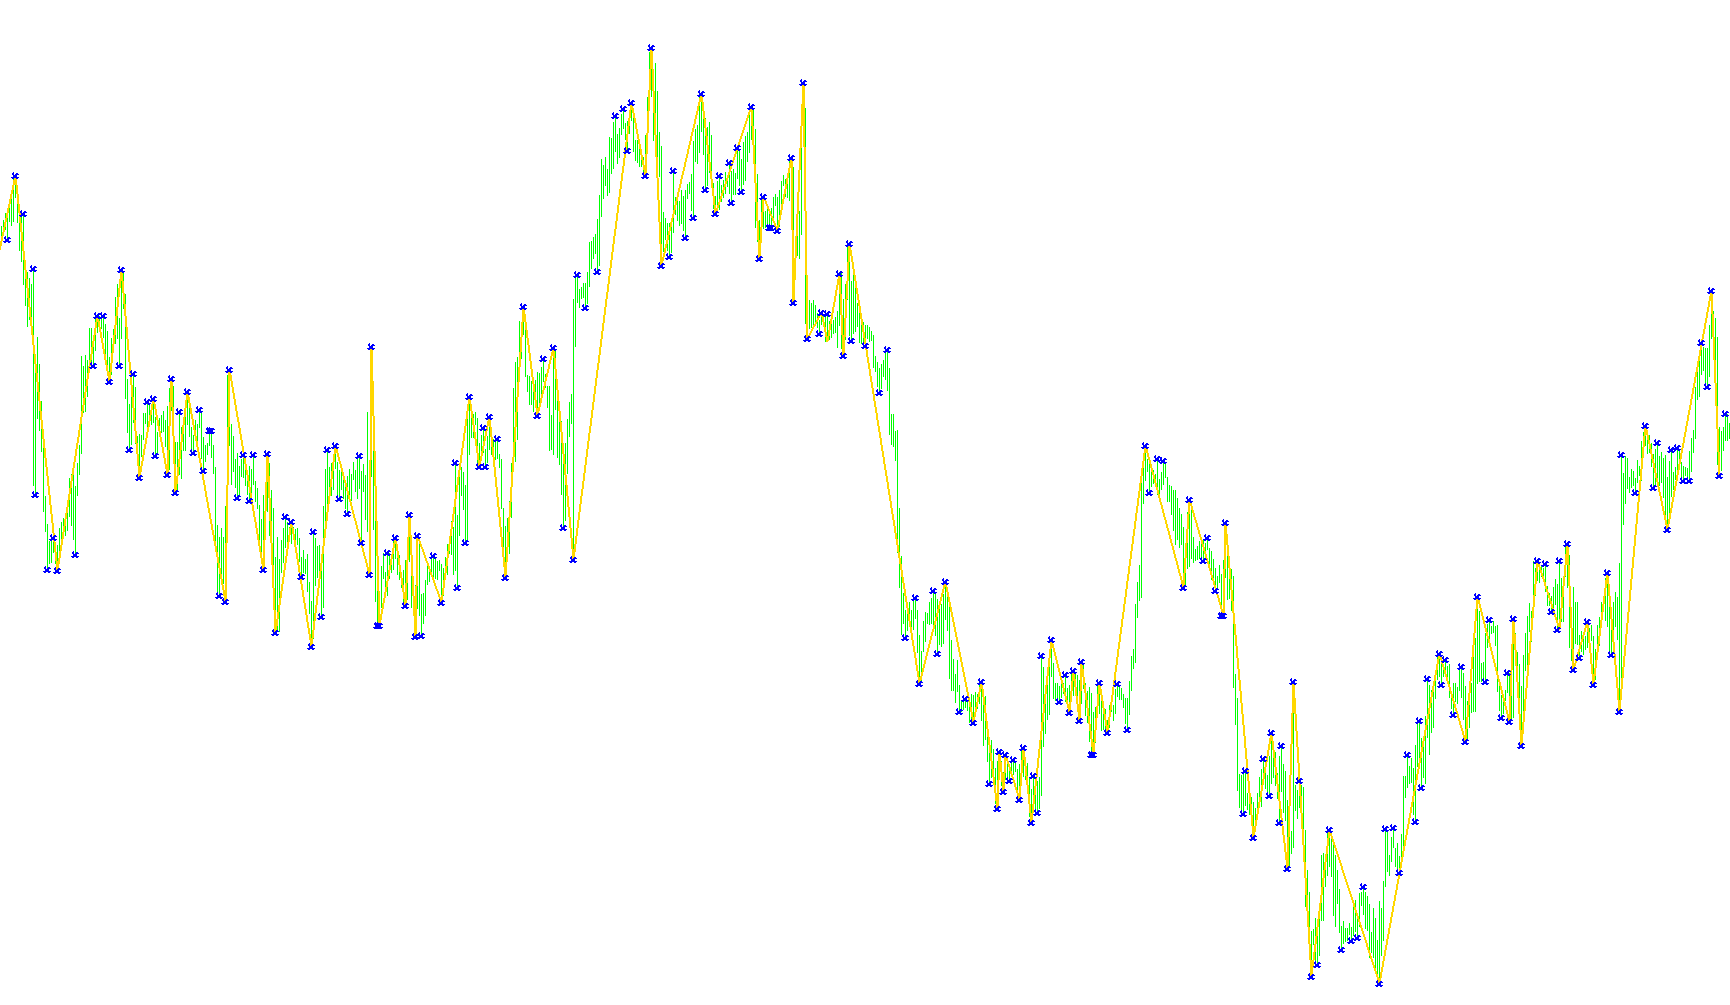
This tool is designed to simplify the way traders visualize price movements on a chart by identifying key structural turning points. It combines two common technical analysis concepts—Fractals and ZigZags—into a single visual aid that highlights major highs and lows while smoothing out the minor market "noise."
Core Logic and Functionality
1. Identifying Structural Peaks and Troughs (Fractals) The script works by scanning the price history to find specific "Fractal" points. Instead of reacting to every tiny tick, it looks for a local peak or trough that is higher (or lower) than a set number of surrounding bars on either side. This ensures that only significant structural changes are highlighted, filtering out insignificant price fluctuations.
2. Connecting the Dots (ZigZag) Once these significant high and low points are identified, the script draws a continuous line connecting them. This creates a "ZigZag" effect. By doing this, the tool allows you to see the primary skeleton of the market trend clearly. It helps in distinguishing between temporary pullbacks and actual trend reversals.
3. Dynamic Trend Tracking The logic follows a specific flow to ensure the lines move logically:
- Trend Awareness: The script keeps track of the current direction (upward or downward).
- High/Low Validation: If the price creates a new high while in an uptrend, or a new low while in a downtrend, the script validates these points as significant.
- Correction Mechanism: If a new point is found that contradicts the current trend (for example, a lower low during an upward move), the script intelligently updates the previous "peak" to ensure the line always flows correctly from one major turn to the next without overlapping or creating messy intersections.
Visual Output
The result on your chart is twofold:
- The ZigZag Line: A solid line that traces the path of least resistance, showing you the "path" the market has taken.
- Fractal Markers: Specific points (arrows) that indicate exactly where a significant structural turn occurred.
Summary for the User
Essentially, this script acts like a filter for your eyes. It ignores the "messy" middle of price action and draws a clear map of the market's peaks and valleys. This makes it much easier to identify support and resistance levels, manage trade structures, and see the overall momentum of the market at a glance.
//+------------------------------------------------------------------+
//|                                               Fractal ZigZag.mq4 |
//|                                                        ikovrigin |
//|                                                                  |
//+------------------------------------------------------------------+
#property copyright "ikovrigin"
#property link      ""

#property indicator_chart_window
#property indicator_buffers 2
#property indicator_color1 White
#property indicator_color2 DeepSkyBlue
//---- input parameters
extern int       Level=2;
//---- buffers
double ExtMapBuffer1[];
double ExtMapBuffer2[];

//+------------------------------------------------------------------+
//| Custom indicator initialization function                         |
//+------------------------------------------------------------------+
int init()
  {
//---- indicators
   SetIndexStyle(0,DRAW_SECTION,STYLE_SOLID,2);
   SetIndexStyle(1,DRAW_ARROW);
   SetIndexBuffer(0,ExtMapBuffer1);
   SetIndexBuffer(1,ExtMapBuffer2);
   SetIndexEmptyValue(0,0.0);
   SetIndexEmptyValue(1,0.0);
   SetIndexLabel(0,"Zigzag");
   SetIndexLabel(1,"Fractal");
//----
   return(0);
  }
//+------------------------------------------------------------------+

//+------------------------------------------------------------------+
//| Custom indicator iteration function                              |
//+------------------------------------------------------------------+
int start()
  {
   int    counted_bars=IndicatorCounted();
//----
   int PU,PD,Trend=2;
   PU=0;
   PD=0;
   double FU,FD,F;
   FU=0;
   FD=0;
   int shift = Bars-Level;
   int n;
   if (shift>Level) shift=shift-Level-1;
   if (counted_bars==0)
   while (shift>Level-1)
   {
   ExtMapBuffer1[shift]=0;
   F=Low[shift];
   for (n=1; n<=Level; n++)
   {
     if (Low[shift+n]<Low[shift] || Low[shift-n]<Low[shift]) F=0;
   }
    if (F>0)
    {
      if (FD!=0)
      switch (Trend)
      {
        case 1:
           if (F<FD)
           {
              ExtMapBuffer1[PU]=FU;
              Trend=2;
           }
           break;
        case 2:
           if (F>FD)
           {
              ExtMapBuffer1[PD]=FD;
              Trend=1;
              if (PU>=PD)
              {
                FU=0;
                PU=0;
              }
           }
           break;
      }
      FD=F;
      PD=shift;
      ExtMapBuffer2[PD]=FD;
      if( ExtMapBuffer2[PD]>0 )
      {
         Alert("Ôðàêòàë îäíàêî!!!");
      }
    }

    F=High[shift];
    for (n=1; n<=Level; n++)
    {
     if (High[shift+n]>High[shift] || High[shift-n]>High[shift]) F=0;
    }
    if (F>0)
    {
      if (FU!=0)
      switch (Trend)
      {
        case 1:
           if (F<FU )
           {
              ExtMapBuffer1[PU]=FU;
              Trend=2;
              if (PD>=PU)
              {
                FD=0;
                PD=0;
              }
           }
           break;
        case 2:
           if (F>FU)
           {
              ExtMapBuffer1[PD]=FD;
              Trend=1;
           }
           break;
      }
      FU=F;
      PU=shift;
      ExtMapBuffer2[PU]=FU;
      if( ExtMapBuffer2[PU]>0 )
      {
         Alert("Ôðàêòàë îäíàêî!!!");
      }
    }
	shift--;
   }
   if (Trend==1) ExtMapBuffer1[PU]=FU; else ExtMapBuffer1[PD]=FD;
//----
   return(0);
  }
//+------------------------------------------------------------------+

//+------------------------------------------------------------------+
//| Custor indicator deinitialization function                       |
//+------------------------------------------------------------------+
int deinit()
  {
//----

//----
   return(0);
  }
//+------------------------------------------------------------------+
Comments