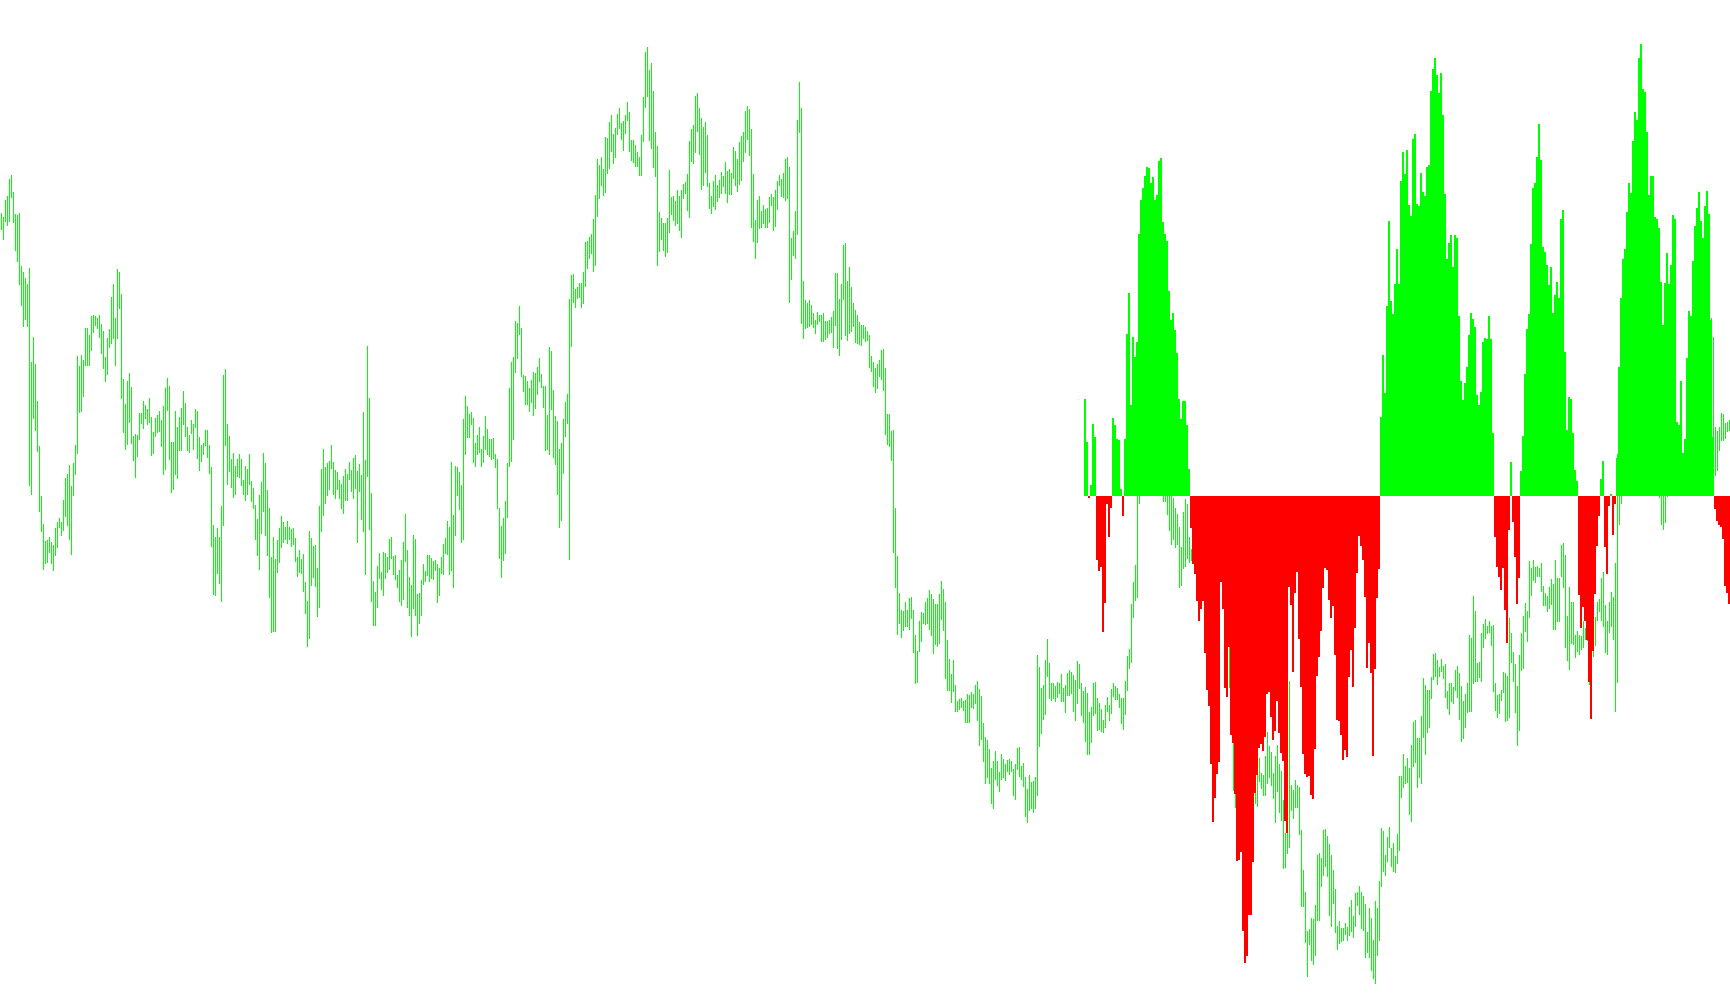
This technical tool is designed to analyze price movements and visualize momentum trends directly on your trading platform. It translates complex mathematical fluctuations into a clear, color-coded visual format that helps traders identify the "strength" of a current market move relative to recent history.
Core Logic & Data Processing
The script begins by analyzing a specific window of recent price data (the "period"). Within this timeframe, it identifies the absolute highest and lowest prices reached. It then calculates a weighted position of the current price—meaning it determines where the current price sits in relation to those extremes.
Rather than reacting instantly to every tiny price flicker, the logic uses a smoothing mechanism. It blends the current price position with previous data points to ensure that the resulting movement is fluid rather than jagged. This helps filter out "noise" and focuses on the underlying trend of the market.
The Visual Indicator
The primary output of this logic is represented as a dual-colored histogram:
- Lime (Green): Represents positive momentum or upward pressure.
- Red: Represents negative momentum or downward pressure.
The height and direction of these bars indicate how aggressively the price is moving in a specific direction compared to the surrounding bars.
Signal Generation
The script includes a sophisticated set of rules to trigger specific alerts on your chart:
- Entry Signals (Buy/Sell): The tool looks for sharp "reversals" or breakthroughs. A signal is triggered when the momentum moves past a specific intensity threshold and shows a clear directional shift compared to the two preceding data points. These appear as text labels on your chart, suggesting high-conviction moments where the trend is accelerating.
- Exit Signals: The logic also monitors for "momentum exhaustion." When the indicator changes direction (e.g., moving from positive to negative territory), it can generate an exit label. This is designed to help traders identify potential turning points where a move might be losing steam.
Key Customizations
The script is highly adaptable, allowing you to refine its behavior based on your trading style:
- Price Source: You can choose which part of the candle the logic focuses on (such as the Close price, the High/Low average, or the Open price).
- Sensitivity: You can toggle a "Fast Mode" to make the indicator react more quickly to real-time changes or use standard settings for a smoother, more conservative view.
- Signal Visibility: You can turn the on-chart text labels (Buy/Sell/Exit) on or off depending on whether you prefer a clean chart or active visual prompts.
/*-----------------------------+
|			       |
| Shared by www.Aptrafx.com    |
|			       |
+------------------------------*/

// FX_FISH
#property copyright "Copyright © 2005, Kiko Segui"
#property link      "webtecnic@terra.es"

#property indicator_separate_window
#property indicator_buffers 2
#property indicator_color1 Lime
#property indicator_color2 Red
#property indicator_level1 0.2
#property indicator_level2 0.5
#property indicator_level3 1.0
#property indicator_level4 -0.2
#property indicator_level5 -0.5
#property indicator_level6 -1.0
// #property indicator_maximum 2
// #property indicator_minimum -2


double buffer1[];
double buffer2[];


extern int period=30;
extern int price=6; // 0 or other = (H+L)/2
                    // 1 = Open
                    // 2 = Close
                    // 3 = High
                    // 4 = Low
                    // 5 = (H+L+C)/3
                    // 6 = (O+C+H+L)/4
                    // 7 = (O+C)/2
extern bool Mode_Fast= True;
extern bool Signals= False;

int init()
  {
  SetIndexStyle(0,DRAW_HISTOGRAM,STYLE_SOLID,2,Lime);
  SetIndexBuffer(0,buffer1);
  SetIndexStyle(1,DRAW_HISTOGRAM,STYLE_SOLID,2,Red);
  SetIndexBuffer(1,buffer2);
  return(0);
  }


int deinit()
  {
  int i;
  double tmp;


  for (i=0;i<Bars;i++)
    {
    ObjectDelete("SELL SIGNAL: "+DoubleToStr(i,0));
    ObjectDelete("BUY SIGNAL: "+DoubleToStr(i,0));
    ObjectDelete("EXIT: "+DoubleToStr(i,0));
    }
  return(0);
  }


double Value=0,Value1=0,Value2=0,Fish=0,Fish1=0,Fish2=0;

int buy=0,sell=0;

int start()
  {
  int i;
  int barras;
  double _price;
  double tmp;

  double MinL=0;
  double MaxH=0;

  double Threshold=1.2;

  barras = Bars;
  if (Mode_Fast)
    barras = 1;
  i = 300;
  while(i>-1)
   {
   MaxH = High[Highest(NULL,0,MODE_HIGH,period,i)];
   MinL = Low[Lowest(NULL,0,MODE_LOW,period,i)];

   switch (price)
     {
     case 1: _price = Open[i]; break;
     case 2: _price = Close[i]; break;
     case 3: _price = High[i]; break;
     case 4: _price = Low[i]; break;
     case 5: _price = (High[i]+Low[i]+Close[i])/3; break;
     case 6: _price = (Open[i]+High[i]+Low[i]+Close[i])/4; break;
     case 7: _price = (Open[i]+Close[i])/2; break;
     default: _price = (High[i]+Low[i])/2; break;
     }


   Value = 0.33*2*((_price-MinL)/(MaxH-MinL)-0.5) + 0.67*Value1;
   Value=MathMin(MathMax(Value,-0.999),0.999);
   Fish = 0.5*MathLog((1+Value)/(1-Value)) -0.5*Fish1 -0.5*Fish2;

   buffer1[i]= 0;
   buffer2[i]= 0;

   if ( (Fish<0) && (Fish1>0))
     {
     if (Signals)
       {
       ObjectCreate("EXIT: "+DoubleToStr(i,0),OBJ_TEXT,0,Time[i],_price);
       ObjectSetText("EXIT: "+DoubleToStr(i,0),"EXIT AT "+DoubleToStr(_price,4),7,"Arial",White);
       }
     buy = 0;
     }
   if ((Fish>0) && (Fish1<0))
     {
     if (Signals)
       {
       ObjectCreate("EXIT: "+DoubleToStr(i,0),OBJ_TEXT,0,Time[i],_price);
       ObjectSetText("EXIT: "+DoubleToStr(i,0),"EXIT AT "+DoubleToStr(_price,4),7,"Arial",White);
       }
     sell = 0;
     }

   if (Fish>=0)
     {
     buffer1[i] = Fish;
     }
   else
     {
     buffer2[i] = Fish;
     }

   tmp = i;
   if ((Fish<-Threshold) &&
       (Fish>Fish1) &&
       (Fish1<=Fish2))
     {
     if (Signals)
       {
       ObjectCreate("SELL SIGNAL: "+DoubleToStr(i,0),OBJ_TEXT,0,Time[i],_price);
       ObjectSetText("SELL SIGNAL: "+DoubleToStr(i,0),"SELL AT "+DoubleToStr(_price,4),7,"Arial",Red);
       }
     sell = 1;
     }

  if ((Fish>Threshold) &&
       (Fish<Fish1) &&
       (Fish1>=Fish2))
    {
    if (Signals)
       {
       ObjectCreate("BUY SIGNAL: "+DoubleToStr(i,0),OBJ_TEXT,0,Time[i],_price);
       ObjectSetText("BUY SIGNAL: "+DoubleToStr(i,0),"BUY AT "+DoubleToStr(_price,4),7,"Arial",Lime);
       }
    buy=1;
    }

   Value1 = Value;
   Fish2 = Fish1;
   Fish1 = Fish;

   i--;
   }
  return(0);
  }
//+------------------------------------------------------------------+
Comments