FX Sniper's Ergodic_CCI_BB
Download script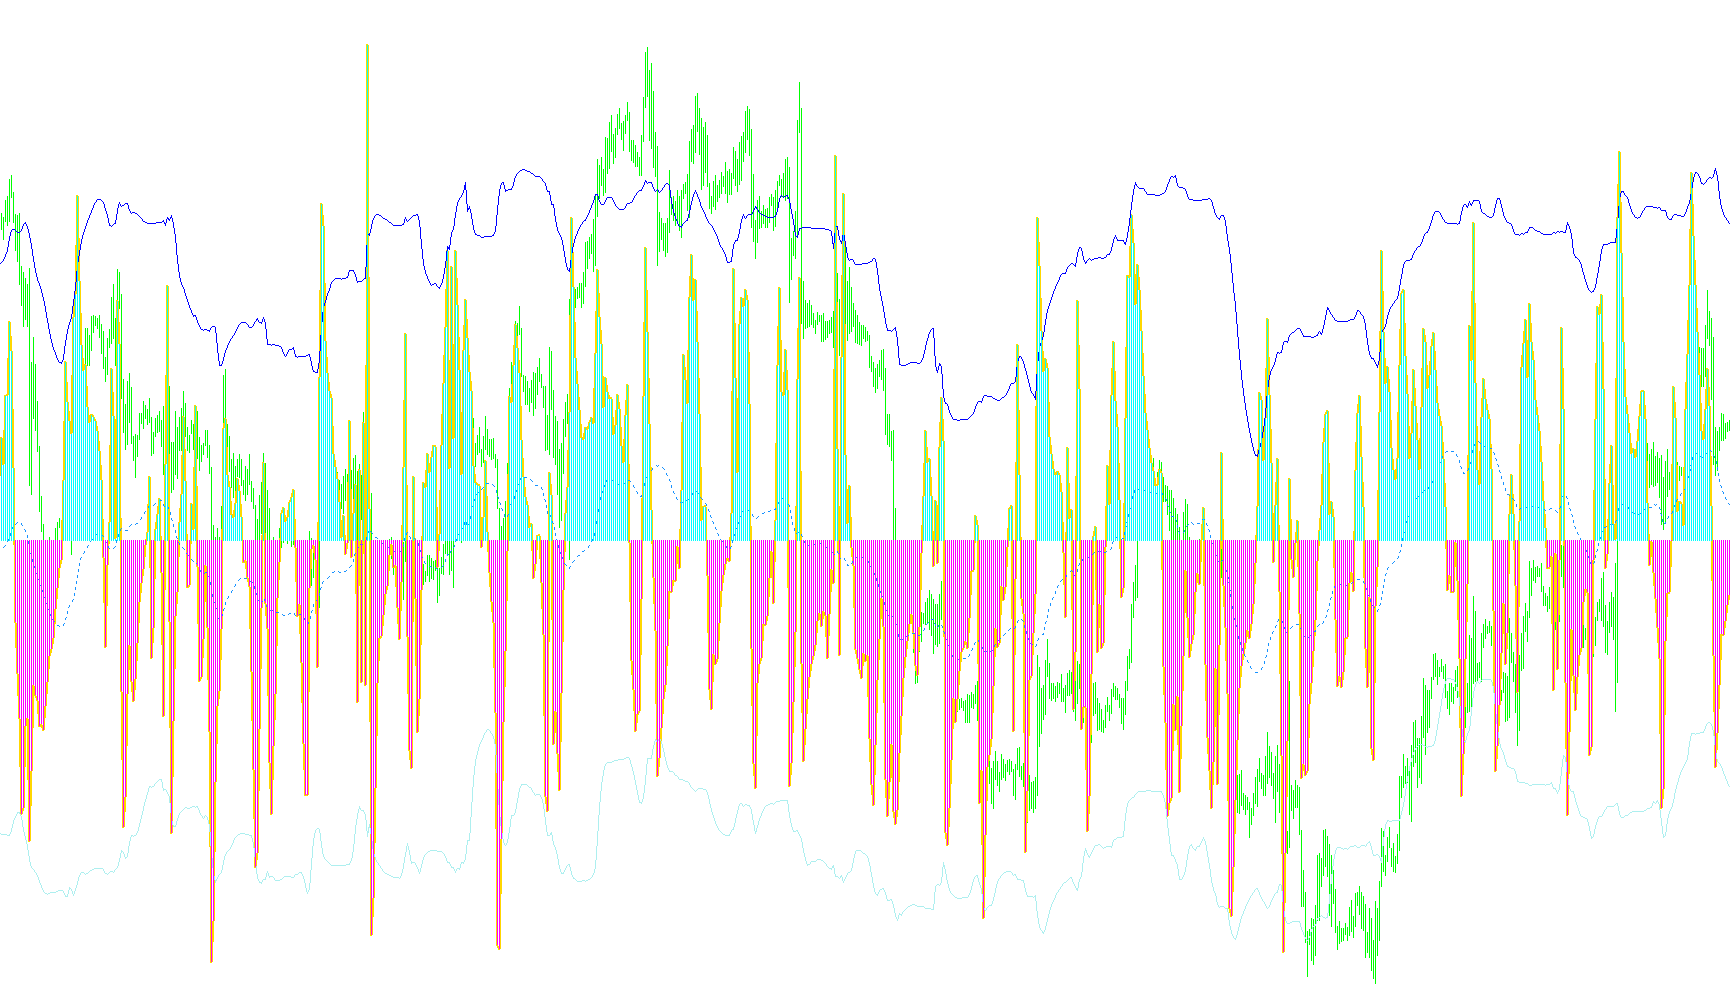
This tool is designed to provide traders with a comprehensive visual summary of market momentum and volatility by combining two well-known technical analysis methods into a single, unified display. Instead of looking at price action alone, this script analyzes the "speed" and "strength" of price movements to help identify overextended markets and potential trend reversals.
Core Logic & Components
The script functions by processing data in three distinct layers:
1. The Momentum Foundation (CCI) At its base, the tool calculates the Commodity Channel Index (CCI). This is a momentum-based oscillator that measures how far the current price has deviated from its recent average. It tells you whether the market is currently "overbought" (trading at a high premium), "oversold" (trading at a deep discount), or moving neutrally.
2. The Volatility Overlay (Bollinger Bands) Rather than applying standard Bollinger Bands directly to the price of an asset, this script applies them to the momentum data mentioned above. By wrapping the CCI oscillator in Bollinger Bands, the tool creates a dynamic "envelope" around the momentum readings. This helps filter out market noise and highlights instances where the momentum is moving significantly faster or slower than what is considered normal for the current period.
3. Directional Signal Filtering To make the data easier to read at a glance, the script categorizes the momentum into two distinct visual signals:
- Bullish Momentum: When the primary indicator moves into positive territory, the tool identifies this as upward pressure.
- Bearish Momentum: When the primary indicator drops below zero, the tool highlights downward pressure.
How it Works for the Trader
By combining these elements, the script provides a multi-dimensional view of the market:
- Trend Identification: It shows you not just which way the price is moving, but how strongly that movement is occurring relative to historical averages.
- Extreme Detection: When the momentum lines push outside the calculated "bands," it suggests that the current move may be reaching an extreme point and could be due for a correction or a reversal.
- Visual Clarity: The logic separates positive and negative momentum into different visual types (histograms and lines), allowing you to instantly distinguish between upward and downward pressure without having to squint at complex price charts.
In summary, this tool acts as a sophisticated "momentum speedometer." It tells you how fast the market is moving, whether that speed is unusual for current conditions, and provides clear visual cues to help you decide when a trend is gaining strength or beginning to exhaust itself.
//+------------------------------------------------------------------+
//|                                       Louw Coetzer aka FX Sniper |
//|                      Copyright © 2004, MetaQuotes Software Corp. |
//|                                       http://www.metaquotes.net/ |
//+------------------------------------------------------------------+
#property  copyright "Copyright © 2004, Fx Sniper."
#property  link      "http://www.dunno.net/"
//---- indicator settings
#property  indicator_separate_window
#property  indicator_buffers 6
#property  indicator_color1  Blue
#property  indicator_color2  White
#property  indicator_color3  White
#property  indicator_color4  Yellow
#property  indicator_color5  Lime
#property  indicator_color6  Red


extern int CCI_period=14;
extern int Bollinger_period=50;
extern int Bollinger_deviation = 2;
extern int Bollinger_shift = 0;

//---- indicator buffers
double MainCCI[];
double BUpper[];
double BLower[];
double BMain[];
double cciHup[];
double cciHdn[];


//+------------------------------------------------------------------+
//| Custom indicator initialization function                         |
//+------------------------------------------------------------------+
int init()
  {
//---- 2 additional buffers are used for counting.
   IndicatorBuffers(8);

//---- drawing settings
   SetIndexStyle(0,DRAW_LINE,STYLE_SOLID,2);
   SetIndexStyle(1,DRAW_LINE,STYLE_SOLID,1);
   SetIndexStyle(2,DRAW_LINE,STYLE_SOLID,1);
   SetIndexStyle(3,DRAW_LINE,STYLE_DOT,1);
   SetIndexStyle(4,DRAW_HISTOGRAM,0,1);
   SetIndexStyle(5,DRAW_HISTOGRAM,0,1);

   SetIndexBuffer(0,MainCCI);
   SetIndexLabel(0,"CCI Indicator");
   SetIndexBuffer(1,BUpper);
   SetIndexBuffer(2,BLower);
   SetIndexBuffer(3,BMain);
   SetIndexLabel(3,"Bollinger Median Line");
   SetIndexBuffer(4,cciHup);
   SetIndexBuffer(5,cciHdn);

//---- name for DataWindow and indicator subwindow label
 IndicatorShortName("FX Sniper CCI with Bollinger Bands ");

//---- initialization done
   return(0);
  }
//+------------------------------------------------------------------+
//| Calculations                                    |
//+------------------------------------------------------------------+
int start()
  {
   int limit;
   int i;
   int counted_bars=IndicatorCounted();
//---- check for possible errors
   if(counted_bars<0) return(-1);
//---- last counted bar will be recounted
   if(counted_bars>0) counted_bars--;
   limit=Bars-counted_bars;

//---- main loop
   for(i=0; i<Bars; i++)
   {
     MainCCI[i]= iCCI(NULL,0,CCI_period,PRICE_TYPICAL,i);
    }

//---- done

   for(i=0; i<Bars; i++)
   {
     BLower[i] = iBandsOnArray(MainCCI,0,Bollinger_period,Bollinger_deviation,Bollinger_shift,MODE_LOWER,i);
     BUpper[i] = iBandsOnArray(MainCCI,0,Bollinger_period,Bollinger_deviation,Bollinger_shift,MODE_UPPER,i);
     BMain[i] = iBandsOnArray(MainCCI,0,Bollinger_period,Bollinger_deviation,Bollinger_shift,MODE_MAIN,i);
   }

     for(i=0; i<Bars; i++)
   {
     if (MainCCI[i] >= 0 )
      cciHup[i] = MainCCI[i];
     else
      cciHup[i] = 0;

       }
    for(i=0; i<Bars; i++)
   {

     if (MainCCI[i] < 0 )
      cciHdn[i] = MainCCI[i];
     else
      cciHdn[i]=0;
   }


   return(0);
  }
//+------------------------------------------------------------------+
Comments