FX5_Divergence_V2.1
Download script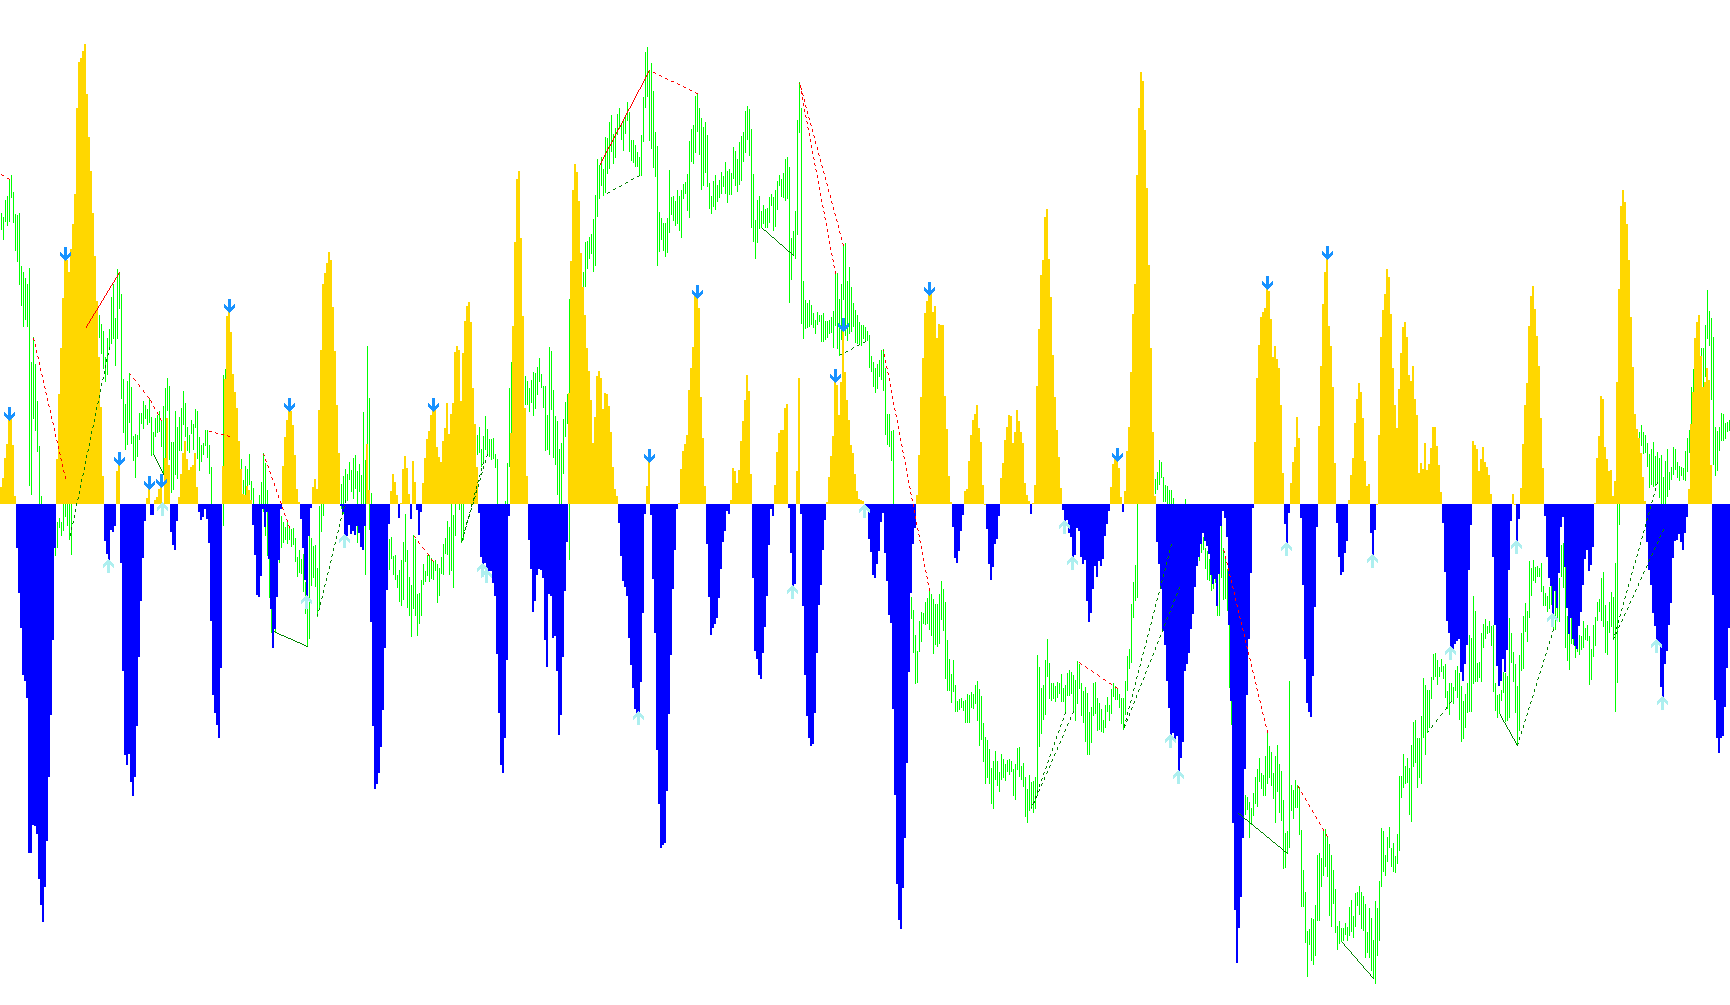
The FX5_Divergence_V2.1 script is a specialized technical analysis tool designed to identify "divergences"—discrepancies between the price action on a market chart and the momentum shown by a specific mathematical indicator. By highlighting these moments, the tool helps traders spot potential reversals where the current trend may be losing steam.
Core Mechanics
The script operates using the following logic:
1. Momentum Tracking (OsMA) The foundation of this tool is the On Balance Volume MA (OsMA). The script calculates this value to determine the underlying momentum of the market. It essentially tracks whether the volume and price movement are pushing in a positive or negative direction, creating a smoother "flow" line that sits in a separate window below your main chart.
2. Peak and Trough Detection The script constantly scans the OsMA data to identify significant structural points:
- Peaks: High points where momentum moves from rising to falling.
- Troughs: Low points where momentum moves from falling to rising. The script is designed to recognize these specific "turning points" rather than just looking at every minor price fluctuation.
3. Divergence Identification This is the primary function of the tool. It compares the current peak/trough with the previous one to see if they are "in agreement":
- Bullish Divergence: The script looks for instances where the market price makes a new lower low, but the OsMA indicator makes a higher low. This suggests that while the price is dropping, the selling pressure is weakening, potentially signaling a future upward move.
- Bearish Divergence: The script looks for instances where the market price makes a new higher high, but the OsMA indicator makes a lower high. This suggests that despite the price rise, the buying momentum is exhausting, potentially signaling a future downward move.
Visual and Alert Features
To make this data actionable for the user, the script includes several automated visual aids:
- Dynamic Line Drawing: When a divergence is detected, the script automatically draws trend lines on both your main chart (showing the price discrepancy) and the indicator window (showing the momentum discrepancy). It uses different line styles (solid vs. dotted) to distinguish between "Classical" and "Reverse" divergences.
- Color Coding: It utilizes distinct colors (Green for bullish trends and Red for bearish trends) to provide immediate visual clarity on the direction of the signal.
- Real-Time Alerts: The tool can be configured to send an instant notification (pop-up alert) as soon as a new divergence is detected, allowing traders to react quickly without having to constantly watch the screens.
Summary for the User
In simple terms, this script acts as a "momentum scout." It watches the hidden energy behind price movements and alerts you when the market's "effort" (momentum) no longer matches its "result" (price). When these two get out of sync, it highlights them with lines and colors, providing an early warning that the current trend might be reaching a turning point.
//+------------------------------------------------------------------+
//|                                          FX5_Divergence_V2.1.mq4 |
//|                                                              FX5 |
//|                                                    hazem@uk2.net |
//+------------------------------------------------------------------+
#property copyright "Copyright © 2007, FX5"
#property link      "hazem@uk2.net"
//----
#property indicator_separate_window
#property indicator_buffers 5
#property indicator_color1 LimeGreen
#property indicator_color2 FireBrick
#property indicator_color3 Green
#property indicator_color4 Red
//---- input parameters
extern string    separator1 = "*** OSMA Settings ***";
extern int       fastEMA = 12;
extern int       slowEMA = 26;
extern int       signal = 9;
extern string    separator2 = "*** Indicator Settings ***";
extern bool      drawDivergenceLines = true;
extern bool      displayAlert = true;
//---- buffers
double upOsMA[];
double downOsMA[];
double bullishDivergence[];
double bearishDivergence[];
double OsMA[];
//----
static datetime lastAlertTime;
//+------------------------------------------------------------------+
//| Custom indicator initialization function                         |
//+------------------------------------------------------------------+
int init()
  {
//---- indicators
   SetIndexStyle(0, DRAW_HISTOGRAM, STYLE_SOLID, 2);
   SetIndexStyle(1, DRAW_HISTOGRAM, STYLE_SOLID, 2);
   SetIndexStyle(2, DRAW_ARROW);
   SetIndexStyle(3, DRAW_ARROW);
   SetIndexStyle(4, DRAW_NONE);
//----
   SetIndexBuffer(0, upOsMA);
   SetIndexBuffer(1, downOsMA);
   SetIndexBuffer(2, bullishDivergence);
   SetIndexBuffer(3, bearishDivergence);
   SetIndexBuffer(4, OsMA);
//----
   SetIndexArrow(2, 233);
   SetIndexArrow(3, 234);
//----
   IndicatorDigits(Digits + 2);
   IndicatorShortName("FX5_Divergence_v2.1(" + fastEMA + "," +
                      slowEMA + "," + signal + ")");
   return(0);
  }
//+------------------------------------------------------------------+
//| Custom indicator deinitialization function                       |
//+------------------------------------------------------------------+
int deinit()
  {
   for(int i = ObjectsTotal() - 1; i >= 0; i--)
     {
       string label = ObjectName(i);
       if(StringSubstr(label, 0, 14) != "DivergenceLine")
           continue;
       ObjectDelete(label);
     }
   return(0);
  }
//+------------------------------------------------------------------+
//| Custom indicator iteration function                              |
//+------------------------------------------------------------------+
int start()
  {
   int countedBars = IndicatorCounted();
   if(countedBars < 0)
       countedBars = 0;
   CalculateIndicator(countedBars);
   return(0);
  }
//+------------------------------------------------------------------+
//|                                                                  |
//+------------------------------------------------------------------+
void CalculateIndicator(int countedBars)
  {
   for(int i = Bars - countedBars; i >= 0; i--)
     {
      CalculateOsMA(i);
      CatchBullishDivergence(i + 2);
      CatchBearishDivergence(i + 2);
     }
  }
//+------------------------------------------------------------------+
//|                                                                  |
//+------------------------------------------------------------------+
void CalculateOsMA(int i)
  {
   OsMA[i] = iOsMA(NULL, 0, fastEMA, slowEMA, signal, PRICE_CLOSE, i);
//----
   if(OsMA[i] > 0)
     {
       upOsMA[i] = OsMA[i];
       downOsMA[i] = 0;
     }
   else
       if(OsMA[i] < 0)
         {
           downOsMA[i] = OsMA[i];
           upOsMA[i] = 0;
         }
       else
         {
           upOsMA[i] = 0;
           downOsMA[i] = 0;
         }
  }
//+------------------------------------------------------------------+
//|                                                                  |
//+------------------------------------------------------------------+
void CatchBullishDivergence(int shift)
  {
   if(IsIndicatorTrough(shift) == false)
       return;
   int currentTrough = shift;
   int lastTrough = GetIndicatorLastTrough(shift);
   if(OsMA[currentTrough] > OsMA[lastTrough] && Low[currentTrough] < Low[lastTrough])
     {
      bullishDivergence[currentTrough] = OsMA[currentTrough];
      if(drawDivergenceLines == true)
        {
          DrawPriceTrendLine(Time[currentTrough], Time[lastTrough], Low[currentTrough],
                             Low[lastTrough], Green, STYLE_SOLID);
          DrawIndicatorTrendLine(Time[currentTrough], Time[lastTrough], OsMA[currentTrough],
                                 OsMA[lastTrough], Green, STYLE_SOLID);
        }
      if(displayAlert == true)
          DisplayAlert("Classical bullish divergence on: ", currentTrough);
     }
   if(OsMA[currentTrough] < OsMA[lastTrough] && Low[currentTrough] > Low[lastTrough])
     {
      bullishDivergence[currentTrough] = OsMA[currentTrough];
      if(drawDivergenceLines == true)
        {
          DrawPriceTrendLine(Time[currentTrough], Time[lastTrough], Low[currentTrough],
                             Low[lastTrough], Green, STYLE_DOT);
          DrawIndicatorTrendLine(Time[currentTrough], Time[lastTrough], OsMA[currentTrough],
                                 OsMA[lastTrough], Green, STYLE_DOT);
        }
      if(displayAlert == true)
          DisplayAlert("Reverse bullish divergence on: ", currentTrough);
     }
  }
//+------------------------------------------------------------------+
//|                                                                  |
//+------------------------------------------------------------------+
void CatchBearishDivergence(int shift)
  {
   if(IsIndicatorPeak(shift) == false)
       return;
   int currentPeak = shift;
   int lastPeak = GetIndicatorLastPeak(shift);

   if(OsMA[currentPeak] < OsMA[lastPeak] && High[currentPeak] > High[lastPeak])
     {
       bearishDivergence[currentPeak] = OsMA[currentPeak];
       if(drawDivergenceLines == true)
         {
           DrawPriceTrendLine(Time[currentPeak], Time[lastPeak], High[currentPeak],
                              High[lastPeak], Red, STYLE_SOLID);
           DrawIndicatorTrendLine(Time[currentPeak], Time[lastPeak], OsMA[currentPeak],
                                  OsMA[lastPeak], Red, STYLE_SOLID);
         }
       if(displayAlert == true)
           DisplayAlert("Classical bearish divergence on: ", currentPeak);
     }
   if(OsMA[currentPeak] > OsMA[lastPeak] && High[currentPeak] < High[lastPeak])
     {
       bearishDivergence[currentPeak] = OsMA[currentPeak];
       if(drawDivergenceLines == true)
         {
           DrawPriceTrendLine(Time[currentPeak], Time[lastPeak], High[currentPeak],
                              High[lastPeak], Red, STYLE_DOT);
           DrawIndicatorTrendLine(Time[currentPeak], Time[lastPeak], OsMA[currentPeak],
                                  OsMA[lastPeak], Red, STYLE_DOT);
         }
       if(displayAlert == true)
           DisplayAlert("Reverse bearish divergence on: ", currentPeak);
     }
  }
//+------------------------------------------------------------------+
//|                                                                  |
//+------------------------------------------------------------------+
bool IsIndicatorPeak(int shift)
  {
   if(OsMA[shift] > 0 && OsMA[shift] > OsMA[shift+1] && OsMA[shift] > OsMA[shift-1])
     {
       for(int i = shift + 1; i < Bars; i++)
         {
           if(OsMA[i] < 0)
              return(true);
           if(OsMA[i] > OsMA[shift])
              break;
         }
     }
   return(false);
  }
//+------------------------------------------------------------------+
//|                                                                  |
//+------------------------------------------------------------------+
bool IsIndicatorTrough(int shift)
  {
   if(OsMA[shift] < 0 && OsMA[shift] < OsMA[shift+1] && OsMA[shift] < OsMA[shift-1])
     {
       for(int i = shift + 1; i < Bars; i++)
         {
           if(OsMA[i] > 0)
               return(true);
           if(OsMA[i] < OsMA[shift])
               break;
         }
     }
   return(false);
  }
//+------------------------------------------------------------------+
//|                                                                  |
//+------------------------------------------------------------------+
int GetIndicatorLastPeak(int shift)
  {
    for(int i = shift + 5; i < Bars; i++)
      {
        if(OsMA[i] >= OsMA[i+1] && OsMA[i] > OsMA[i+2] &&
           OsMA[i] >= OsMA[i-1] && OsMA[i] > OsMA[i-2])
            return(i);
      }
    return(-1);
  }
//+------------------------------------------------------------------+
//|                                                                  |
//+------------------------------------------------------------------+
int GetIndicatorLastTrough(int shift)
  {
    for(int i = shift + 5; i < Bars; i++)
      {
        if(OsMA[i] <= OsMA[i+1] && OsMA[i] < OsMA[i+2] &&
           OsMA[i] <= OsMA[i-1] && OsMA[i] < OsMA[i-2])
            return(i);
      }
    return(-1);
  }
//+------------------------------------------------------------------+
//|                                                                  |
//+------------------------------------------------------------------+
void DisplayAlert(string message, int shift)
  {
   if(shift <= 2 && Time[shift] != lastAlertTime)
     {
       lastAlertTime = Time[shift];
       Alert(message, Symbol(), " , ", Period(), " minutes chart");
     }
  }
//+------------------------------------------------------------------+
//|                                                                  |
//+------------------------------------------------------------------+
void DrawPriceTrendLine(datetime x1, datetime x2, double y1,
                        double y2, color lineColor, double style)
  {
   string label = "DivergenceLine2.1# " + DoubleToStr(x1, 0);
   ObjectDelete(label);
   ObjectCreate(label, OBJ_TREND, 0, x1, y1, x2, y2, 0, 0);
   ObjectSet(label, OBJPROP_RAY, 0);
   ObjectSet(label, OBJPROP_COLOR, lineColor);
   ObjectSet(label, OBJPROP_STYLE, style);
  }
//+------------------------------------------------------------------+
//|                                                                  |
//+------------------------------------------------------------------+
void DrawIndicatorTrendLine(datetime x1, datetime x2, double y1,
                            double y2, color lineColor, double style)
  {
   int indicatorWindow = WindowFind("FX5_Divergence_v2.1(" + fastEMA +
                                    "," + slowEMA + "," + signal + ")");
   if(indicatorWindow < 0)
       return;
   string label = "DivergenceLine2.1$# " + DoubleToStr(x1, 0);
   ObjectDelete(label);
   ObjectCreate(label, OBJ_TREND, indicatorWindow, x1, y1, x2, y2, 0, 0);
   ObjectSet(label, OBJPROP_RAY, 0);
   ObjectSet(label, OBJPROP_COLOR, lineColor);
   ObjectSet(label, OBJPROP_STYLE, style);
  }
//+------------------------------------------------------------------+
Comments