Gann Hi-lo Activator SSL_001
Download script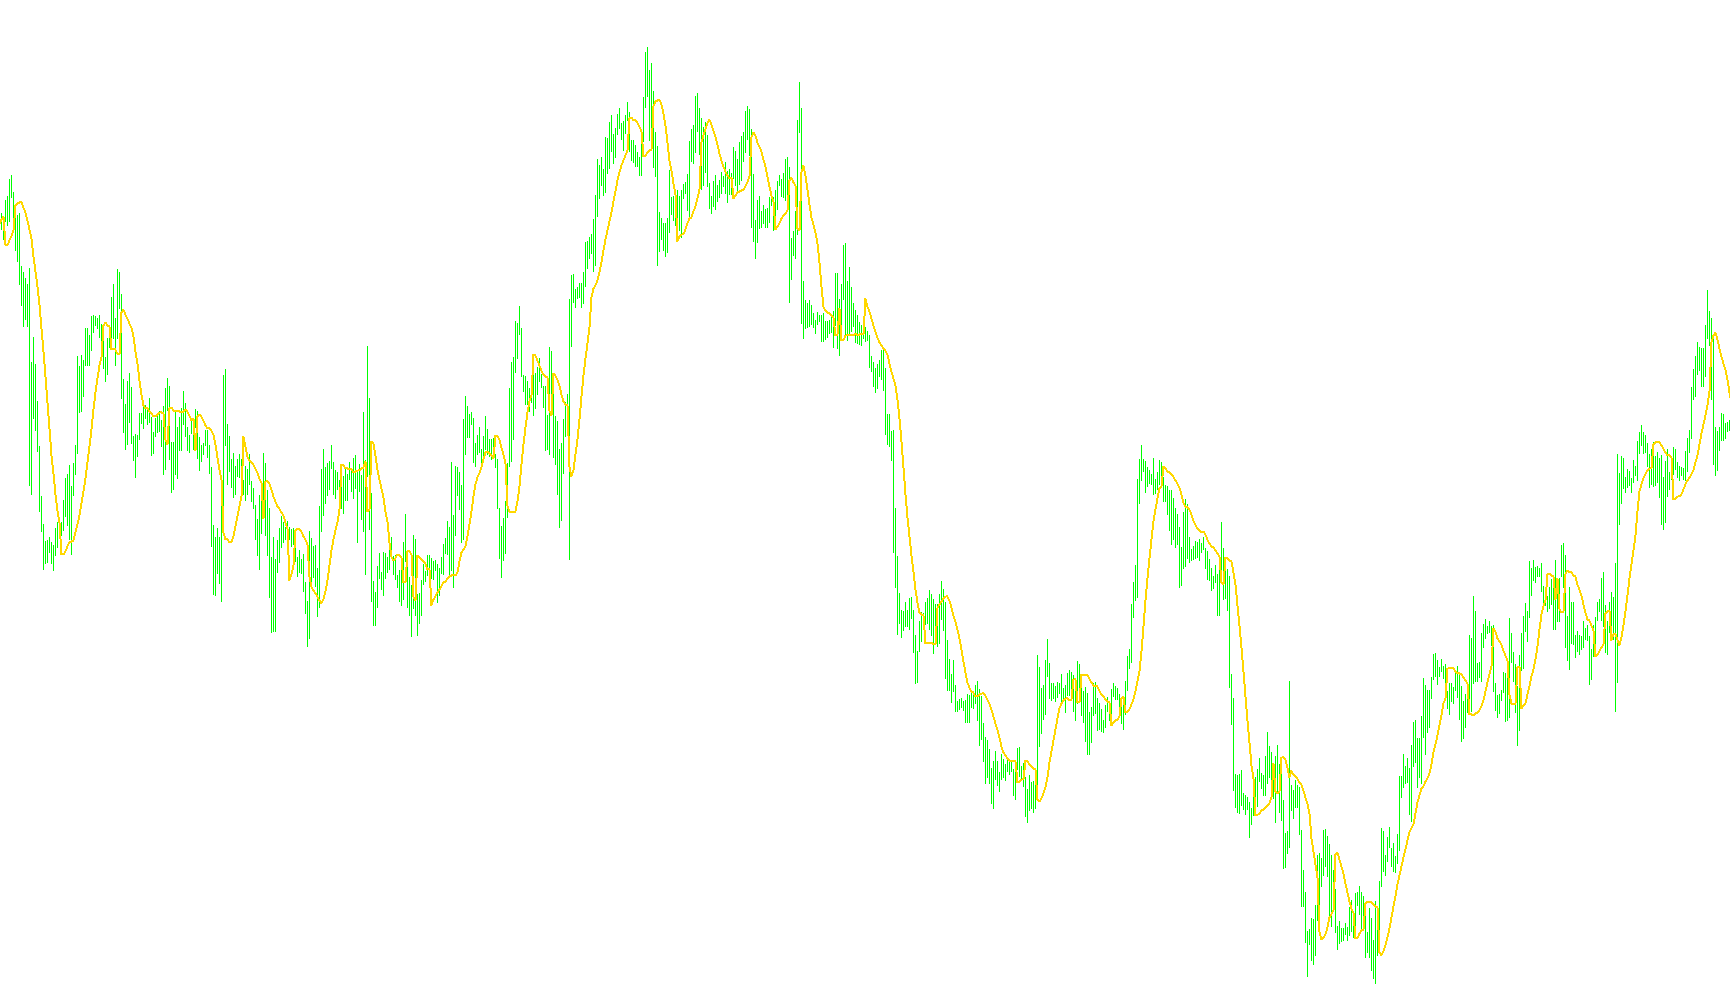
This tool is designed to provide visual guidance on market trends by identifying specific price action patterns and plotting a continuous line on your chart. Rather than just showing a simple average, it dynamically shifts its focus based on how the current market price interacts with recent highs and lows.
How the Logic Works
The core functionality of this indicator relies on three main components: Price Comparison, Trend Detection, and Dynamic Line Plotting. Here is a breakdown of how these work together:
1. Establishing the Baseline The script looks at a specific number of previous candles (defined by the "Lb" setting) to calculate two different types of averages: one based on the highest prices reached during that period and another based on the lowest. These act as the boundaries for the market's recent movement.
2. Determining the Market State The logic constantly evaluates where the current closing price sits in relation to these boundaries:
- Bullish Sentiment: If the price closes above the average of previous highs, the system identifies a positive momentum.
- Bearish Sentiment: If the price closes below the average of previous lows, the system identifies a negative momentum.
- Neutral State: If the price is neither significantly above the highs nor below the lows, the system remains in a "holding" state, maintaining its previous direction.
3. Dynamic Visual Output Instead of jumping erratically from one point to another, the indicator uses a "memory" logic. Once it detects a shift into a bullish or bearish state, it "locks" onto that sentiment.
Depending on which direction is detected:
- When the market is in a bullish state, the visible line on your chart is drawn based on the high prices of previous candles.
- When the market shifts to a bearish state, the line automatically switches to be drawn based on the low prices of previous candles.
Summary for the Trader
In simple terms, this indicator acts as a trend-following line that "hugs" the price action. It reacts to breakouts: when prices break toward the upside, the line shifts to follow the high points; when they break toward the downside, it follows the low points. This provides a visual representation of whether the current market momentum is leaning towards the upper or lower boundaries of recent trading activity.
//+------------------------------------------------------------------+
//|                                                          SSL.mq4 |
//|                                                          Kalenzo |
//|                                      bartlomiej.gorski@gmail.com |
//+------------------------------------------------------------------+
#property copyright "Kalenzo"
#property link      "bartlomiej.gorski@gmail.com"
//----
#property indicator_buffers 1
#property indicator_color1 Blue
extern int Lb=10;
double ssl[],Hld,Hlv;
#property indicator_chart_window
//+------------------------------------------------------------------+
//| Custom indicator initialization function                         |
//+------------------------------------------------------------------+
int init()
  {
//---- indicators
   SetIndexBuffer(0,ssl);
   SetIndexStyle(0,DRAW_LINE,STYLE_SOLID,2);
//----
   return(0);
  }
//+------------------------------------------------------------------+
//| Custom indicator deinitialization function                       |
//+------------------------------------------------------------------+
int deinit()
  {
//----
//----
   return(0);
  }
//+------------------------------------------------------------------+
//| Custom indicator iteration function                              |
//+------------------------------------------------------------------+
int start()
  {
//----
   for(int i=Bars-Lb;i>=0;i--)
     {
      if(Close[i]>iMA(Symbol(),0,Lb,0,MODE_SMA,PRICE_HIGH,i+1))
         Hld=1;
      else
        {
         if(Close[i]<iMA(Symbol(),0,Lb,0,MODE_SMA,PRICE_LOW,i+1))
            Hld=-1;
         else
            Hld=0;
        }
      if(Hld!=0)
         Hlv=Hld;
      if(Hlv==-1)
         ssl[i]=iMA(Symbol(),0,Lb,0,MODE_SMA,PRICE_HIGH,i+1);
      else
         ssl[i]=iMA(Symbol(),0,Lb,0,MODE_SMA,PRICE_LOW,i+1);
     }
//----
   return(0);
  }
//+------------------------------------------------------------------+
Comments