gen_PCCI
Download script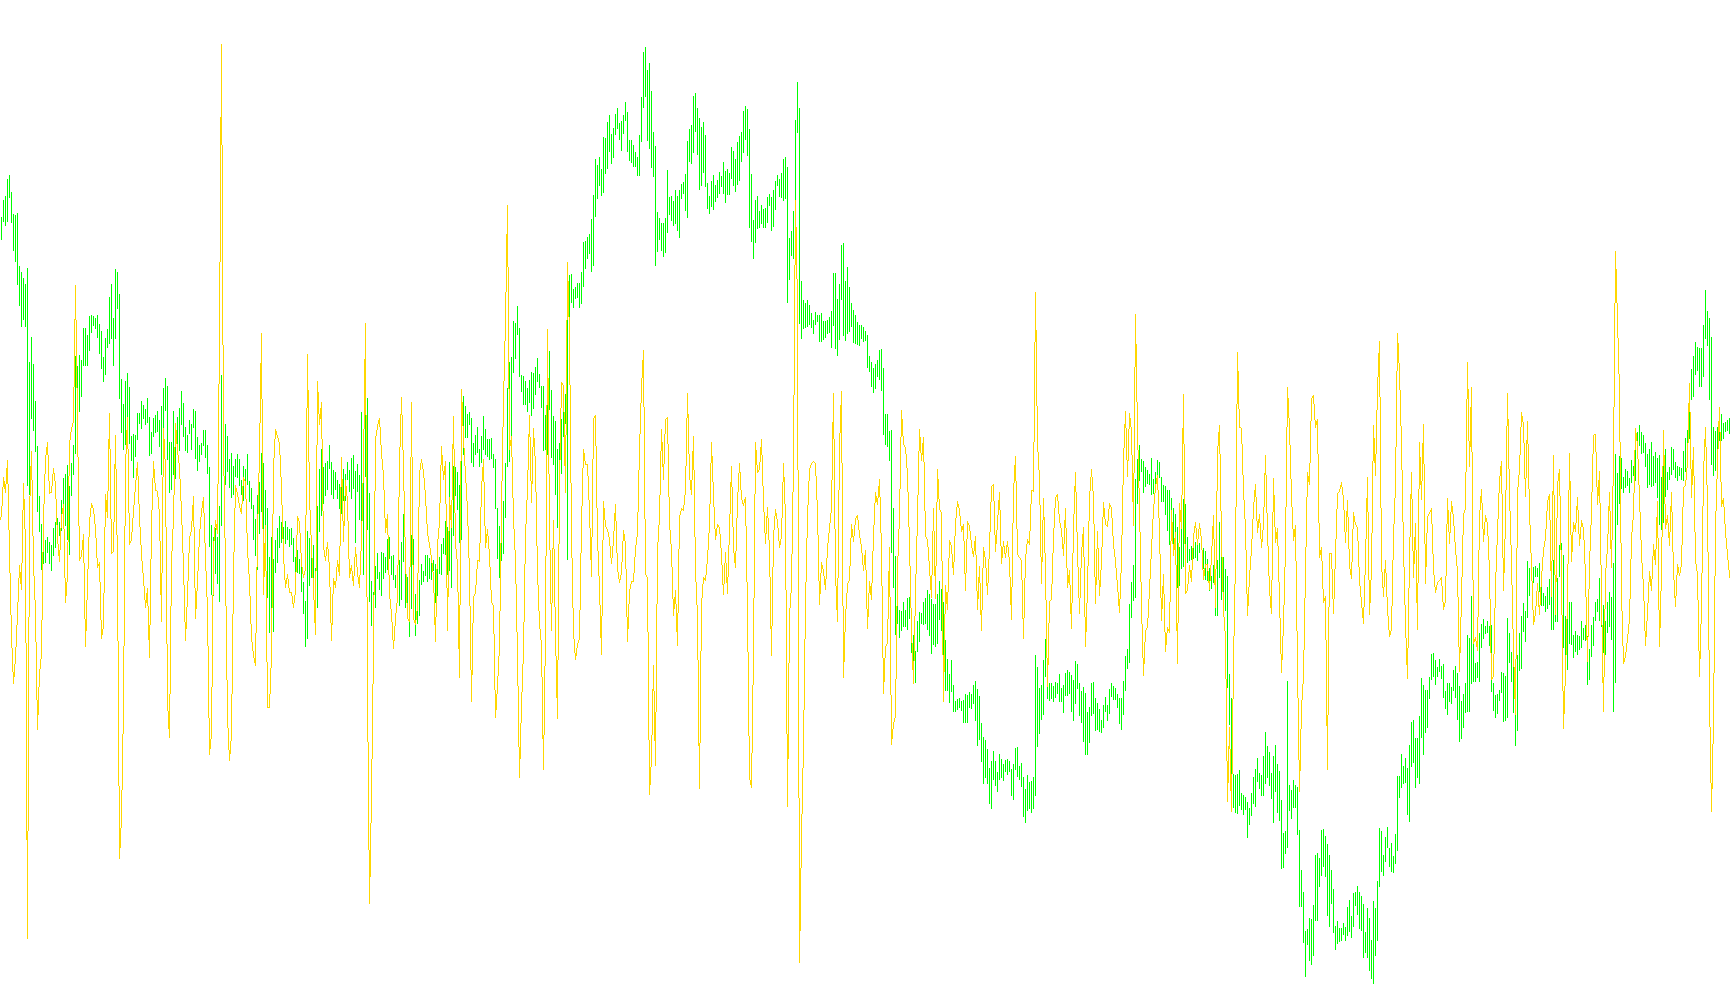
This technical tool is a specialized trading indicator designed for the MetaTrader platform. Its primary purpose is to perform "Digital Filtering" on price data to help traders identify underlying trends more clearly by smoothing out market noise.
Core Functional Logic
1. Data Selection and Customization The script allows users to choose specific types of price data to analyze. You can select between the standard closing price, opening price, high, or low of a candle. Additionally, it includes a timeframe setting that allows the indicator to look at larger historical periods to calculate its current readings.
2. The Filtering Mechanism At the heart of this script is a pre-defined mathematical array (a set of specific weights). The logic works by taking the current price and comparing it against a weighted average of previous prices based on these coefficients.
- Instead of simply showing you where the price is now, it calculates a "filtered" value.
- By subtracting this weighted calculation from the actual price, the script isolates specific movements in the market.
3. Signal Smoothing and Interpolation To ensure the visual output is fluid and continuous, the logic employs an interpolation method. If the indicator is looking at a timeframe larger than your current chart (for example, looking at 4-hour data while viewing a 1-hour chart), the script calculates the "step" or distance between two known points. It then fills in the gaps mathematically so that the line appears smooth and unbroken on your screen.
4. Automation and User Interaction The script includes an automated administrative routine that checks for user feedback. Every five days, it performs a background check to see if the user has interacted with the tool's "donation" or "support" feature. If not, it can trigger a system message box asking for feedback and provide a direct link to the author’s payment portal if requested by the user.
Summary of Operation
In simple terms: The script looks at the market history, applies a complex set of mathematical weights to that history to filter out "noise," and then draws a red line on your chart. This line represents the filtered price movement, helping you visualize the trend more clearly than raw price action alone.
// -----------------------------------------------------------------
//  PCCI
//  Dmitry Yakovlev
//  dmitry_yakovlev@rambler.ru
//  WebMoney R865705290089
//------------------------------------------------------------------
// Parameters DF:
// PCCI:   P1=14, D1=10, A1=40, P2=0, D2=0, A2=0, Ripple=0.08, Delay=0


#property copyright "Dmitry Yakovlev, Russia,Omsk WM R865705290089"
#property link      "dmitry_yakovlev@rambler.ru"

#property indicator_separate_window
#property indicator_buffers 1
#property indicator_color1 Red
#property indicator_level1 0

#import  "shell32.dll"           //Connect a dll (provided with Windows)
  int ShellExecuteA(int hwnd,string Operation,string File,string Parameters,string Directory,int ShowCmd);
#import "user32.dll"
  int MessageBoxA(int hWnd ,string lpText,string lpCaption,int uType);
//------------------------------------------------------------------------------------------------------


// ÏÀÐÀÌÅÒÐÛ
extern string  _tf="Òàéìôðåéì (0-òåêóùèé)";
extern int     tf=0;
extern string  _pr="Öåíà 0-cl,1-op,2-hi,3-lo";
extern int     pr=0;
extern string  _donate1="Äëÿ $ áëàãîäàðíîñòè:";
extern string  _donate2="R865705290089";

//---- buffers
double iBuffer[];

double F[]=
{
0.342152940854,+0.3093292710818,+0.2494886026077,+0.1729967470992,+0.0925637619799,+0.02063133334364,-0.0330807757871,
-0.0633224564657,-0.0699201252728,-0.0571825815615,-0.0326138365275,-0.00472222203391,+0.01887417755416,
+0.0330626229331,+0.0359799385551,+0.02892153255004,+0.01547756053013,+0.0002774619935816,-0.01239612720349,
-0.01962143471368,-0.02040646532991,-0.01564282987562,-0.00754279142733,+0.001162950482821,+0.00803410120806,
+0.01154650780504,+0.01135097902722,+0.00815882017765,+0.00337147099221-0.001454786740187-0.00509465397315,
-0.00705602263847,-0.00791744078702,-0.00996601702916,+0.00455978659094
};
int FilterSize=0;
//+------------------------------------------------------------------+
//| Digital filter indicator initialization function                 |
//+------------------------------------------------------------------+
int init()
{
   CheckDonate();

   FilterSize=ArraySize(F);

   if(tf<Period()) tf=Period();
   if(pr>1)pr=0;
   //---- indicator line

   IndicatorShortName("PCCI-"+tf);

   //---- indicator line
   SetIndexStyle(0,DRAW_LINE);
   SetIndexBuffer(0,iBuffer);
   //----
   return(0);
}

//+------------------------------------------------------------------+
double price(int i)
{
   if(pr==0) return(iClose(Symbol(),tf,i));
   else if(pr==1) return(iOpen(Symbol(),tf,i));
   else if(pr==2) return(iHigh(Symbol(),tf,i));
   else if(pr==3) return(iLow(Symbol(),tf,i));
}
//+------------------------------------------------------------------+
int start()
{
   int k, nn, nn1, i, j, counted_bars=IndicatorCounted();
   int koef=(tf/Period());
   double res=0, step=0;
   // <--- ðàñ÷èòûâàåì çíà÷åíèÿ èíäèêàòîðà
   if (FilterSize>0)
   {
      if(Bars<=FilterSize) return(0);
      //-------------------------------
      i=(Bars-counted_bars+FilterSize-1)/koef+1;
      //-------------------------------
      while(i>=0)
      {
         res=0;
         for (j=0; j<FilterSize; j++)
            res+=F[j]*price(i+j);

         nn=i*koef;
         if(nn!=-1) iBuffer[nn]=price(i)/Point-res/Point;

         nn1=(i+1)*koef;
         if(nn!=-1 && nn1!=-1 && iBuffer[nn1]!=EMPTY_VALUE && iBuffer[nn1]!=0)
         {
            step=(iBuffer[nn1]-iBuffer[nn])/koef;
            for(k=1;k<koef;k++) iBuffer[k+nn]=iBuffer[nn]+step*k;
         }
         i--;
      }
   } else return;
   // ðàñ÷èòûâàåì -->
   //-------------------------------------------------------------------------
   return(0);
}

void CheckDonate()
{
   int fd=0; string pay="0"; datetime dt=0;
   string fn="DigFlts1.txt";
   fd=FileOpen(fn,FILE_READ|FILE_CSV,";");
   if(fd>=1)
   {
      pay=FileReadString(fd); if(pay!="0" && pay!="1") pay="0";
      dt=StrToTime(FileReadString(fd));
   }
   else
   {
      dt=TimeCurrent();
      fd=FileOpen(fn,FILE_WRITE|FILE_CSV,";");
      FileWrite(fd,"0",TimeToStr(dt,TIME_DATE));
   }
   FileClose(fd);

   if(pay=="0" && (TimeCurrent()-dt)>10*24*60*60) // 5 äíåé
   {
      if(MessageBoxA(0,"Åñëè Âàì ïîíðàâèëñÿ èíäèêàòîð PCCI,\n õîòèòå ïîìî÷ü àâòîðó ìàòåðèàëüíî?","Âîïðîñ",4)==6)
      {
         ShellExecuteA(0,"Open","iexplore.exe","wmk:payto?Purse=R865705290089&Amount=100&Desc=DigitalIndicators&BringToFront=Y&ExecEvenKeeperIsOffline=Y","",7);
         pay="1";
      }
      dt=TimeCurrent();

      fd=FileOpen(fn,FILE_WRITE|FILE_CSV,";");
      FileWrite(fd,pay,TimeToStr(dt,TIME_DATE));
      FileClose(fd);
   }
   FileClose(fd);
}
Comments