Gioteen-Norm
Download script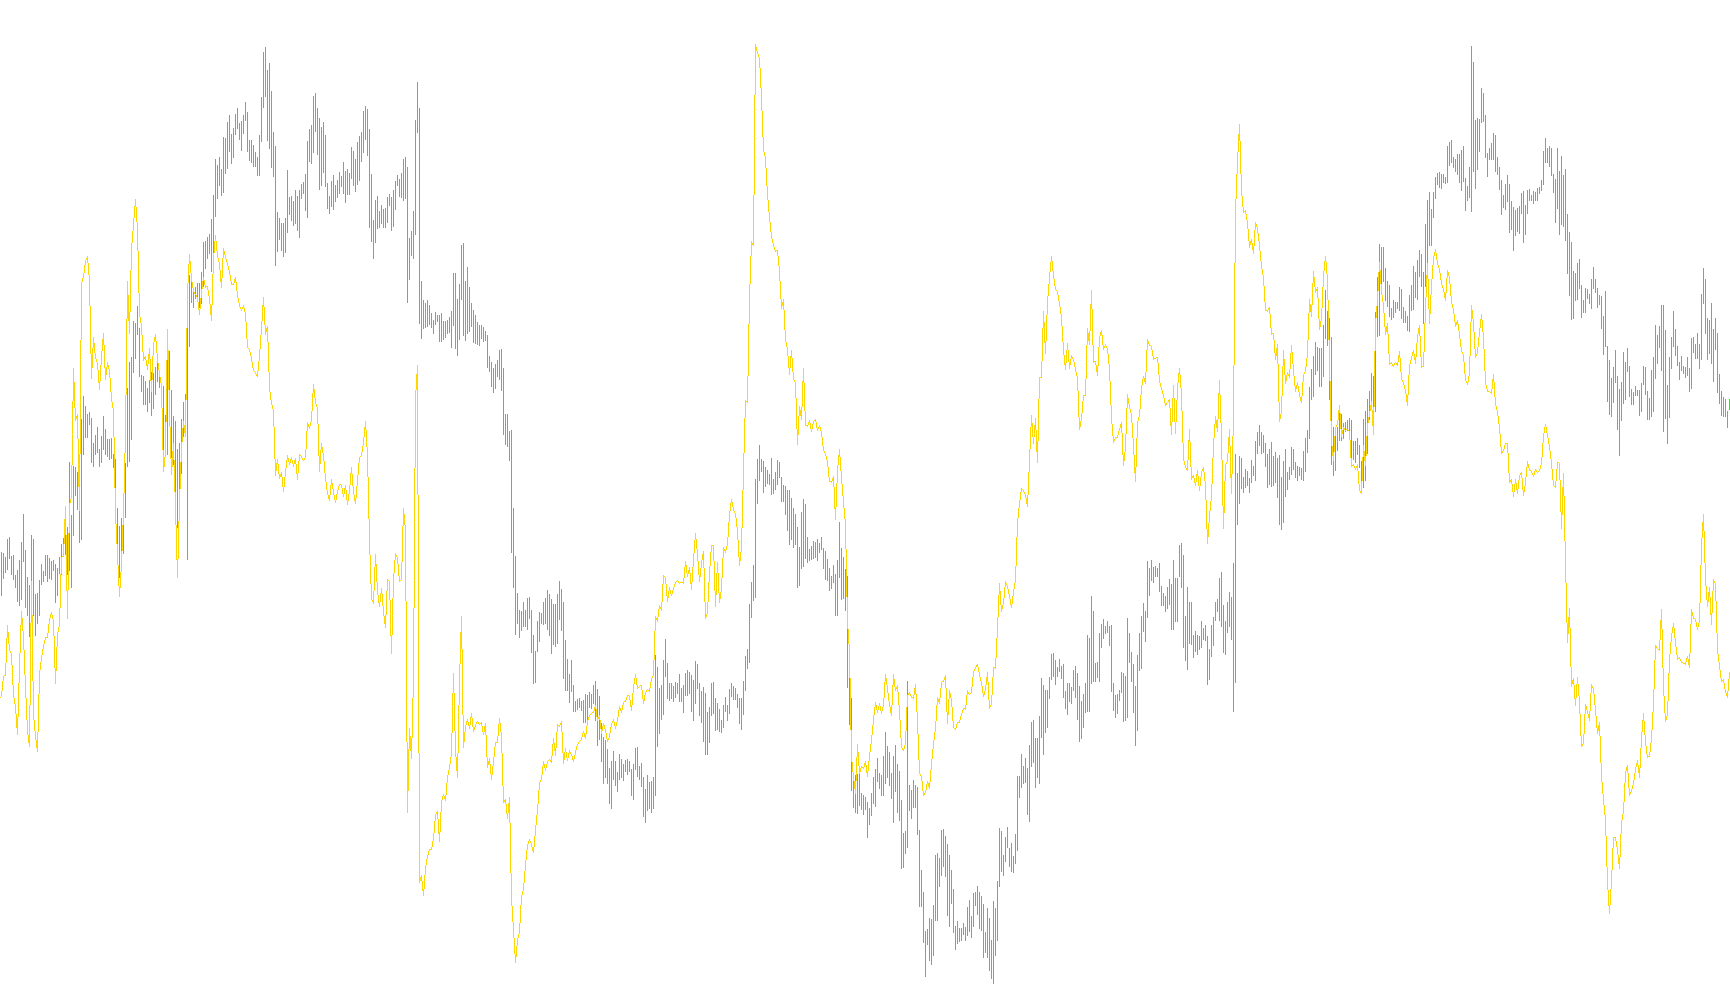
This tool is designed to provide a visual representation of the relationship between the current market price and its moving average, specifically highlighting how much the price deviates from the established trend. Instead of simply showing you the price or the average alone, it calculates a "normalized" difference that helps traders understand the intensity of price movements relative to historical volatility.
How the Logic Works
The script processes market data through three primary logical steps:
1. Price Selection and Tracking The tool allows you to choose which specific price point to monitor (such as the opening, closing, highest, or lowest price of a candle). It identifies the current market value based on your preference and compares it against a Moving Average—a calculation that smooths out price fluctuations to show the general direction of the market.
2. Volatility Measurement (Standard Deviation) To make the data meaningful, the script calculates the "Standard Deviation." In simple terms, this looks at how much the price has been swinging up and down over a set period of time. By understanding these swings, the tool can distinguish between a "normal" market move and an "extreme" one. It establishes a baseline for what the market considers a typical fluctuation.
3. Normalization and Visualization This is the core logic of the script. Rather than showing you a raw number (which might vary wildly depending on the asset you are trading), the script takes the difference between the current price and the Moving Average, then divides that difference by the Standard Deviation calculated in the previous step.
What this means for the user
By "normalizing" the data this way, the indicator produces a consistent line on your chart. It tells you how many "units of volatility" the price is currently away from its average.
- Low values suggest that the price is hugging the moving average closely, indicating a stable or sideways market.
- High values indicate that the price has moved significantly far away from its average, highlighting potential overextended moves or strong momentum that might require attention.
Essentially, it acts as a "stretch" meter, showing you exactly how far the rubber band of the market is being pulled away from its center point.
//+-------------------------------------------------------------------------+
//|                                                         Giotee-Norm.mq4 |
//|                                                 Copyright 2016, Gioteen |
//|                                   https://www.mql5.com/en/users/gioteen |
//+-------------------------------------------------------------------------+
#property copyright "Copyright 2016, Gioteen"
#property link      "https://www.mql5.com/en/users/gioteen"
#property version   "1.00"
#property strict


#property indicator_separate_window
#property indicator_buffers 1
#property indicator_plots   1
//--- plot Label1
#property indicator_label1  "Label1"
#property indicator_type1   DRAW_LINE
#property indicator_color1  clrRed
#property indicator_style1  STYLE_SOLID
#property indicator_width1  2
//--- indicator buffers
double         Label1Buffer[];
extern string sym="";
extern int ExtPeriod=100;
extern int ExtMAMethod=0;
extern int ExtAppliedPrice=0;
extern int ExtShift=0;
int    nCountedBars,i;
//+------------------------------------------------------------------+
//| Custom indicator initialization function                         |
//+------------------------------------------------------------------+
int OnInit()
  {
//--- indicator buffers mapping
   SetIndexBuffer(0,Label1Buffer);
//---
   return(INIT_SUCCEEDED);
  }
//+------------------------------------------------------------------+
//| Custom indicator iteration function                              |
//+------------------------------------------------------------------+
int OnCalculate(const int rates_total,
                const int prev_calculated,
                const datetime &time[],
                const double &open[],
                const double &high[],
                const double &low[],
                const double &close[],
                const long &tick_volume[],
                const long &volume[],
                const int &spread[])
  {
//---
if(Bars<=ExtPeriod) return(0);

   nCountedBars=IndicatorCounted();

   i=Bars-ExtPeriod-1;
   if(nCountedBars>ExtPeriod)
      i=Bars-nCountedBars;
   while(i>=0)
     {
      double st=std2(i);
      if(st==0)
         st=0.00001;
      Label1Buffer[i]=(GetAppliedPrice(ExtAppliedPrice,i)-iMA(sym,0,ExtPeriod,0,ExtMAMethod,ExtAppliedPrice,i))/st;

      i--;
      }

   return(rates_total);
  }
//+------------------------------------------------------------------+


double std2(int k)
{
      double dAPrice=0;
      double dAmount=0.0;
      double dMovingAverage=iMA(sym,0,ExtPeriod,0,ExtMAMethod,ExtAppliedPrice,k);
      for(int j=0; j<ExtPeriod; j++)
        {
         dAPrice=GetAppliedPrice(ExtAppliedPrice,k+j);
         dAmount+=(dAPrice-dMovingAverage)*(dAPrice-dMovingAverage);
        }
      return(MathSqrt(dAmount/ExtPeriod));
}

double GetAppliedPrice(int nAppliedPrice, int nIndex)
  {
   double dPrice;
//----
   switch(nAppliedPrice)
     {
      case 0:  dPrice=iClose(sym,0,nIndex);                                  break;
      case 1:  dPrice=iOpen(sym,0,nIndex);                                   break;
      case 2:  dPrice=iHigh(sym,0,nIndex);                                   break;
      case 3:  dPrice=iLow(sym,0,nIndex);                                    break;
      case 4:  dPrice=(iHigh(sym,0,nIndex)+iLow(sym,0,nIndex))/2.0;                 break;
      case 5:  dPrice=(iHigh(sym,0,nIndex)+iLow(sym,0,nIndex)+iClose(sym,0,nIndex))/3.0;   break;
      case 6:  dPrice=(iHigh(sym,0,nIndex)+iLow(sym,0,nIndex)+2*iClose(sym,0,nIndex))/4.0; break;
      default: dPrice=0.0;
     }
     return(dPrice);
 }
Comments