_Grachi_Mika53
Download script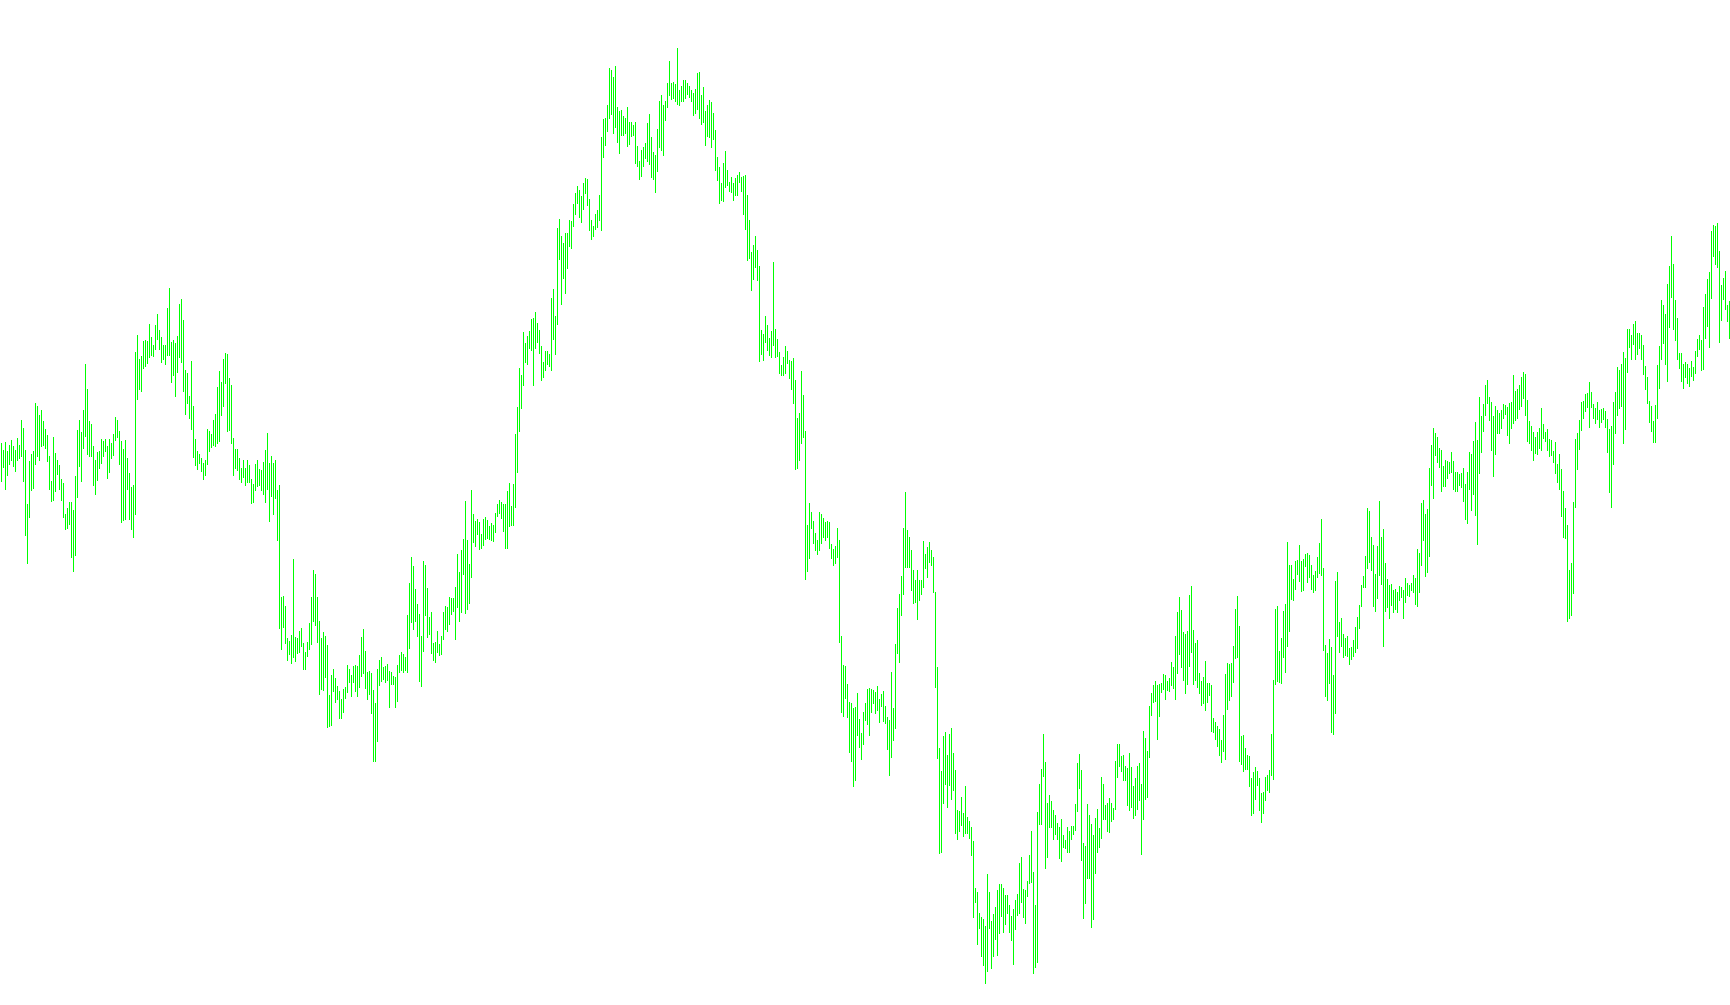
This script functions as a specialized visual analysis tool designed to identify significant structural patterns in price movements. Rather than looking at every minor fluctuation in the market, it focuses on highlighting major "turning points" by filtering out standard market noise.
Core Logic and Functionality
The tool operates by utilizing a sophisticated calculation method to track the peaks and valleys of price action. It essentially acts as a structural map for the chart, performing the following steps:
- Data Filtering: The script processes historical price data to identify primary high points and low points. It uses specific mathematical parameters (Depth, Deviation, and Backstep) to ensure that only significant reversals are captured, preventing the tool from reacting to insignificant "wiggles" in the price line.
- Pattern Recognition: By analyzing these highs and lows, the script identifies a sequence of market movements. It distinguishes between upward momentum and downward momentum by tracking the alternating nature of these peaks and valleys.
- Visual Signaling: The primary purpose of the script is to plot specific points on your chart. It categorizes these signals into distinct types:
- It highlights specific structural anchors (represented in gray) to show the overall shape of the trend.
- It uses specific colors (Blue and Red) to signal alternating movements. This helps traders visually identify when a trend has shifted from one direction to another.
- Sequential Analysis: The logic includes a counting mechanism that tracks the order of these reversals. By keeping track of whether a point is an even or odd occurrence in a sequence, it can automatically assign different visual markers to "peaks" versus "valleys," making it easier for a user to see the rhythm of the market.
Summary for the User
Think of this script as a "skeletal" view of the market. It strips away the messy details of minute-to-minute price changes and draws a clear path of the major turns. By using different colors and markers for alternating peaks and valleys, it provides a clear visual summary of the current market structure, helping you identify where the trend is heading and where the most significant historical turning points have occurred.
//+------------------------------------------------------------------+
//|                                                  Grachi_Mika.mq4 |
//|                      Copyright © 2008, MetaQuotes Software Corp. |
//|                                        http://www.metaquotes.net |
//| Èíäèêàòîð íàïèñàí ïî ñèñòåìå òîðãîâëè îïèñàííîé âîò çäåñü:       |
//| http://forum.fibo-forex.ru/viewtopic.php?t=1368                  |
//+------------------------------------------------------------------+
#property copyright "Copyright © 2008, MetaQuotes Software Corp."
#property link      "http://www.xrusr@land.ru"
//---------------
//---- indicator parameters
extern int ExtDepth = 12;
extern int ExtDeviation = 5;
extern int ExtBackstep = 3;
//---------------
#property indicator_chart_window
#property indicator_buffers 4
#property indicator_color1 Gray
#property indicator_color2 Gray
#property indicator_color3 Blue
#property indicator_color4 Red
//---- buffers
double ExtMapBuffer1[];
double ExtMapBuffer2[];
double ExtMapBuffer3[];
double ExtMapBuffer4[];
//+------------------------------------------------------------------+
//| Custom indicator initialization function                         |
//+------------------------------------------------------------------+
int init()
  {
//---- indicators
   SetIndexStyle(0,DRAW_SECTION);
   SetIndexBuffer(0,ExtMapBuffer1);
   SetIndexEmptyValue(0,0.0);
   SetIndexStyle(1,DRAW_SECTION);
   SetIndexBuffer(1,ExtMapBuffer2);
   SetIndexEmptyValue(1,0.0);
   SetIndexStyle(2,DRAW_SECTION,EMPTY,2);
   SetIndexBuffer(2,ExtMapBuffer3);
   SetIndexEmptyValue(2,0.0);
   SetIndexStyle(3,DRAW_SECTION,EMPTY,2);
   SetIndexBuffer(3,ExtMapBuffer4);
   SetIndexEmptyValue(3,0.0);
//----
   return(0);
  }
//+------------------------------------------------------------------+
//| Custom indicator deinitialization function                       |
//+------------------------------------------------------------------+
int deinit()
  {
//----

//----
   return(0);
  }
//+------------------------------------------------------------------+
//| Custom indicator iteration function                              |
//+------------------------------------------------------------------+
int start()
  {
   int    counted_bars=IndicatorCounted();
//----
   int ap=0,dn=0;
//----
   if(counted_bars>0)
        counted_bars--;

   int limit=Bars-counted_bars;
   for(int i=0;i<Bars;i++)
   {
   ExtMapBuffer1[i]=iCustom(NULL, 0, "Zigzag2_R_", ExtDepth, ExtDeviation, ExtBackstep, 0, i);
   ExtMapBuffer2[i]=iCustom(NULL, 0, "Zigzag2_R_", ExtDepth, ExtDeviation, ExtBackstep, 1, i);
   if(ExtMapBuffer1[i]!=0){ExtMapBuffer4[i]=ExtMapBuffer1[i];}
   if(ExtMapBuffer2[i]!=0){ExtMapBuffer4[i]=ExtMapBuffer2[i];}
   if(ExtMapBuffer1[i]!=0)
    {
     ap++;
      if(ap%2==0){dn++;ExtMapBuffer3[i]=ExtMapBuffer1[i];}
       }

   if(ExtMapBuffer2[i]!=0)
    {
    dn++;
     if(dn%2==0){ap++;ExtMapBuffer3[i]=ExtMapBuffer2[i];}
      }
   }
//----
   return(0);
  }
//+------------------------------------------------------------------+
Comments