HA_Signal_Alert
Download script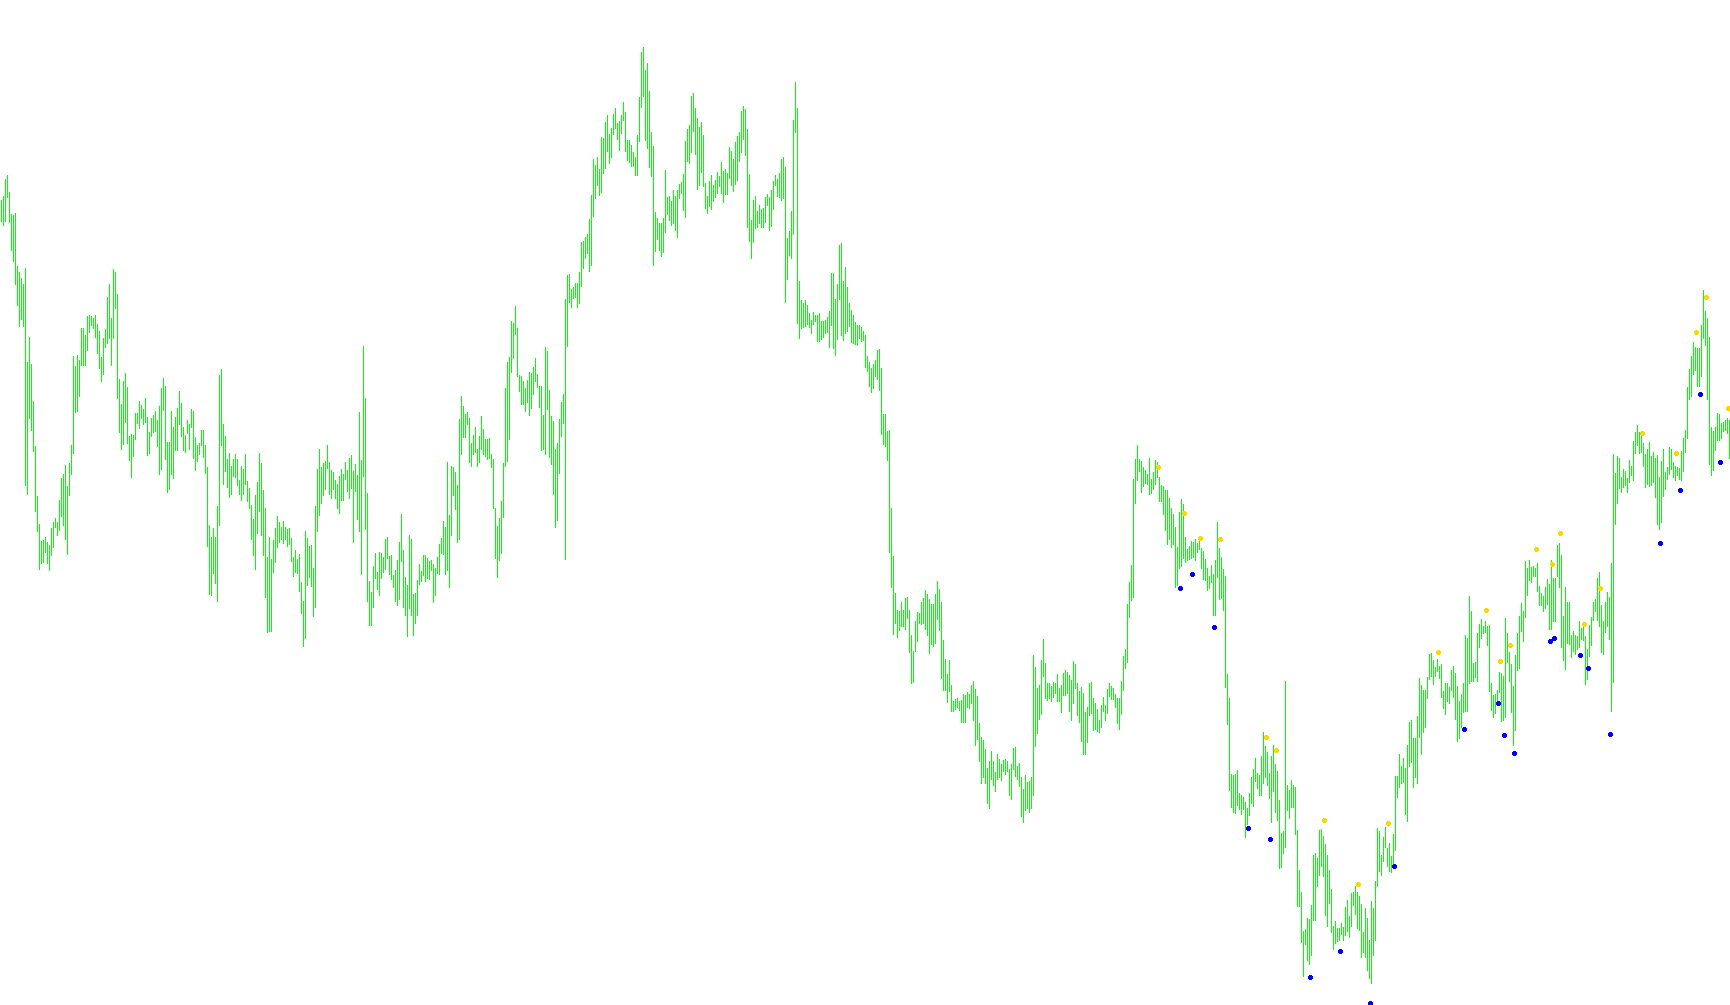
This technical indicator is designed to identify specific market trend reversals by analyzing price action volatility and momentum relative to historical averages. Rather than relying on a single moving average, it uses a multi-layered logic system to determine "overbought" or "oversold" conditions based on the following three primary components:
1. Volatility and Range Analysis
The script begins by calculating the average price range over a rolling window of recent candles. It measures the difference between the highest and lowest prices to establish a baseline for "normal" market movement. This range is then used as a benchmark to identify significant price actions, such as large gaps or sudden bursts in momentum that may indicate a shift in trend.
2. Dynamic Threshold Detection
The tool monitors the relationship between current candle prices and previous closing prices. It specifically looks for instances where the gap between candles exceeds double the established average range. By detecting these "true" movements, the script attempts to filter out market noise and focus only on high-impact price shifts.
3. Momentum Calculation (WPR Logic)
The script utilizes a modified version of the Williams Percent Range (WPR). It dynamically adjusts its internal parameters (the "Risk" factor) based on whether significant momentum has been detected in the preceding candles. By calculating where the current price sits relative to the highest highs and lowest lows over a specific period, it converts market activity into a percentage-based value.
Signal Generation Logic
The final visual signals are triggered when these three components align in a specific sequence:
- Sell Signals: These occur when the momentum value drops below a defined lower threshold. The script then looks backward to ensure that the momentum has actually crossed through a "neutral zone" to reach that low point, confirming a sustained downward move. A red arrow is plotted on the chart at the high of the candle.
- Buy Signals: These occur when the momentum value rises above a defined upper threshold. Similar to the sell logic, it verifies that the price has transitioned from a neutral state into an overbought zone. A blue arrow is plotted at the low of the candle.
User Experience Features
- Visual Feedback: The script plots clear arrows on the chart to indicate where potential entry signals are occurring.
- Alert System: It includes an integrated notification system that triggers an audible alert and a text pop-up when a new signal appears in real-time.
- On-Screen Commentary: For users who want to see the underlying data, the script displays the raw numerical values (such as current momentum and range calculations) directly on the chart area during live trading.
//+------------------------------------------------------------------+
//| ASCTrend1sig_noSound.mq4
//| Ramdass - Conversion only
//+------------------------------------------------------------------+

#property indicator_chart_window
#property indicator_buffers 2
#property indicator_color1 Red
#property indicator_color2 DodgerBlue

//---- input parameters
extern int RISK=1;
extern int CountBars=300;
extern bool SoundON=true;
bool TurnedUp = false;
bool TurnedDown = false;

//---- buffers
double val1[];
double val2[];


//+------------------------------------------------------------------+
//| Custom indicator initialization function                         |
//+------------------------------------------------------------------+
int init()
  {
//---- indicator line
   IndicatorBuffers(2);
   SetIndexStyle(0,DRAW_ARROW);
   SetIndexArrow(0,159);
   SetIndexStyle(1,DRAW_ARROW);
   SetIndexArrow(1,159);
   SetIndexBuffer(0,val1);
   SetIndexBuffer(1,val2);

//----
   return(0);
  }
//+------------------------------------------------------------------+
//| ASCTrend1sig                                                     |
//+------------------------------------------------------------------+
int start()
  {
   if (CountBars>=1000) CountBars=950;
   SetIndexDrawBegin(0,Bars-CountBars+11+1);
   SetIndexDrawBegin(1,Bars-CountBars+11+1);
   int i,shift,counted_bars=IndicatorCounted();
   int Counter,i1,value10,value11;
   double value1,x1,x2;
   double value2,value3;
   double TrueCount,Range,AvgRange,MRO1,MRO2;
   double Table_value2[1000];

   value10=3+RISK*2;
   x1=67+RISK;
   x2=33-RISK;
   value11=value10;
//----
   if(Bars<=11+1) return(0);
//---- initial zero
   if(counted_bars<11+1)
   {
      for(i=1;i<=0;i++) val1[CountBars-i]=0.0;
      for(i=1;i<=0;i++) val2[CountBars-i]=0.0;
   }
//----
   shift=CountBars-11-1;
   while(shift>=0)
     {

   Counter=shift;
	Range=0.0;
	AvgRange=0.0;
	for (Counter=shift; Counter<=shift+9; Counter++) AvgRange=AvgRange+MathAbs(High[Counter]-Low[Counter]);

	Range=AvgRange/10;
	Counter=shift;
	TrueCount=0;
	while (Counter<shift+9 && TrueCount<1)
		{if (MathAbs(Open[Counter]-Close[Counter+1])>=Range*2.0) TrueCount=TrueCount+1;
		Counter=Counter+1;
		}
	if (TrueCount>=1) {MRO1=Counter;} else {MRO1=-1;}
	Counter=shift;
	TrueCount=0;
	while (Counter<shift+6 && TrueCount<1)
		{if (MathAbs(Close[Counter+3]-Close[Counter])>=Range*4.6) TrueCount=TrueCount+1;
		Counter=Counter+1;
		}
	if (TrueCount>=1) {MRO2=Counter;} else {MRO2=-1;}
	if (MRO1>-1) {value11=3;} else {value11=value10;}
	if (MRO2>-1) {value11=4;} else {value11=value10;}
	value2=100-MathAbs(iWPR(NULL,0,value11,shift)); // PercentR(value11=9)
	Table_value2[shift]=value2;
	val1[shift]=0;
	val2[shift]=0;
	value3=0;
	if (value2<x2)
		{i1=1;
		while (Table_value2[shift+i1]>=x2 && Table_value2[shift+i1]<=x1){i1++;}
		if (Table_value2[shift+i1]>x1)
			{
			value3=High[shift]+Range*0.5;
			val1[shift]=value3;
			  if (shift == 0 && SoundON==true && !TurnedUp){
            Alert("EJ Sell signal at ", Symbol(),"-",Period());
            TurnedUp = true;
            TurnedDown = false;
      }
			  Comment("High val1= ",val1[shift],"val2= ",val2[shift],"value2= ",value2,"value3= ",value3,"shift= ",shift);
			}
		}
	if (value2>x1)
		{i1=1;
		while (Table_value2[shift+i1]>=x2 && Table_value2[shift+i1]<=x1){i1++;}
		if (Table_value2[shift+i1]<x2)
			{
			value3=Low[shift]-Range*0.5;
			val2[shift]=value3;
       if (shift == 0 && SoundON==true && !TurnedDown){
            Alert("EJ Buy signal at ",Symbol(),"-",Period());
            TurnedDown = true;
            TurnedUp = false;
      }
					  Comment("Low val1= ",val1[shift],"val2= ",val2[shift],"value2= ",value2,"value3= ",value3,"shift= ",shift);

			}
  		}

      shift--;
     }

   return(0);
  }
//+------------------------------------------------------------------+
Comments