Heiken_Ashi_Mod
Download script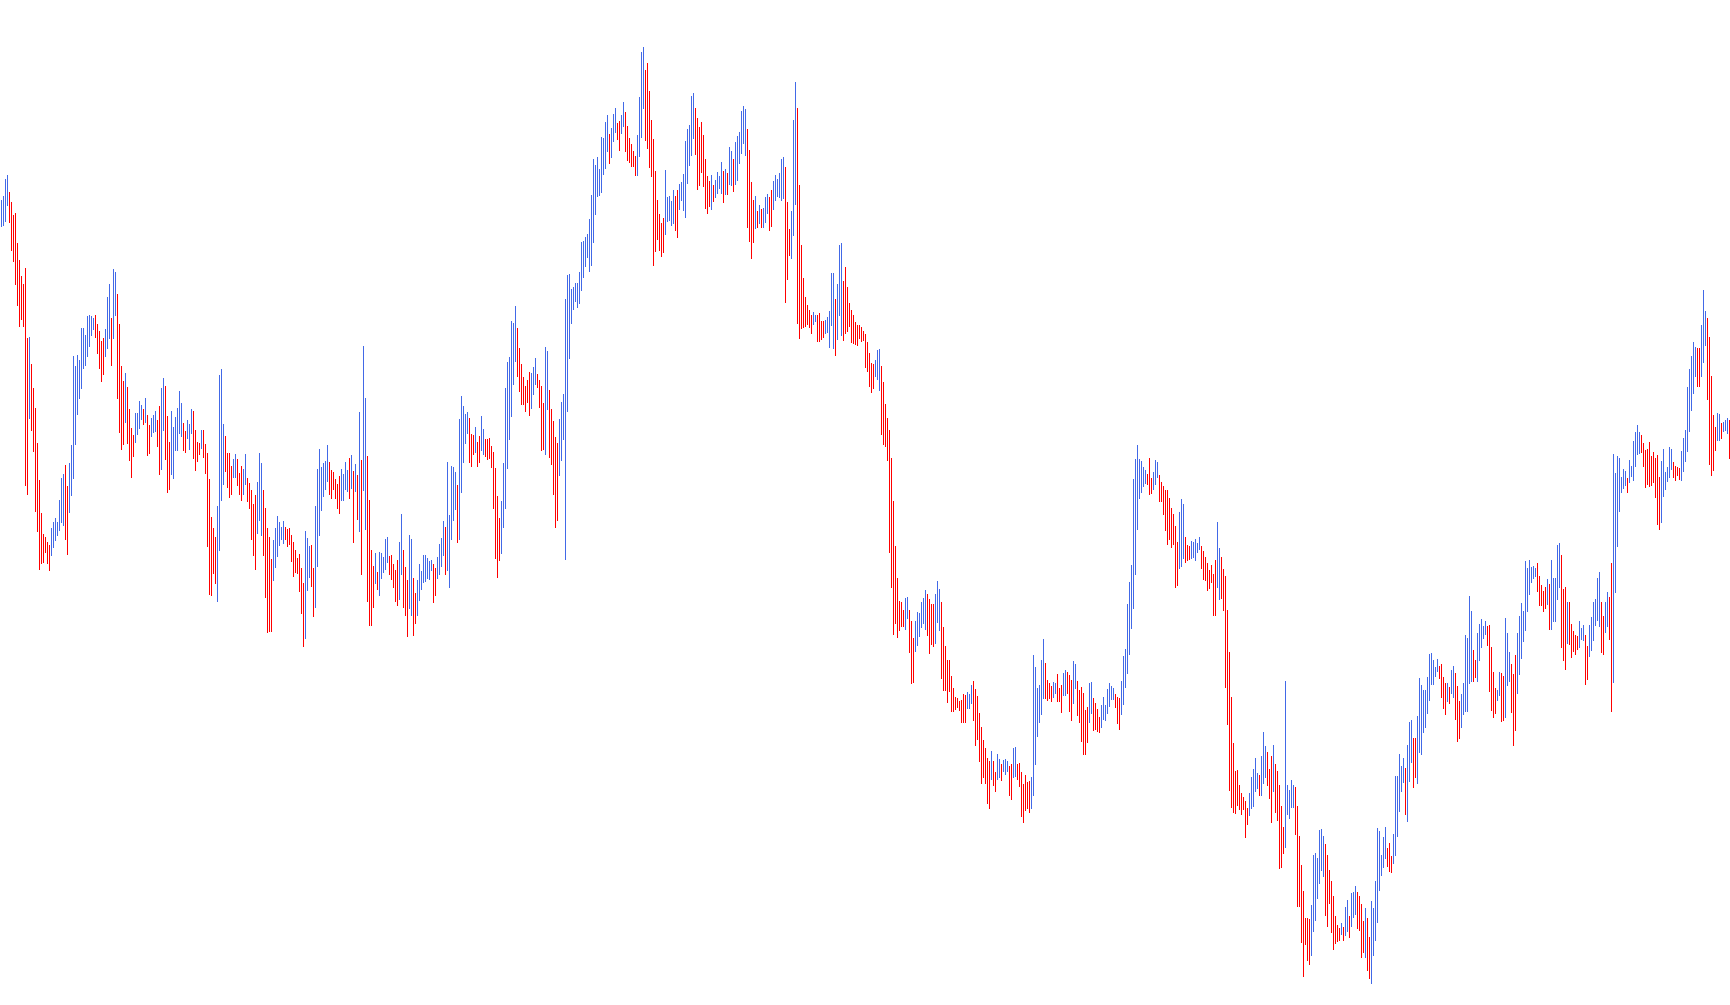
This custom indicator is designed to transform the standard price action on your trading chart into a specialized visual format known as Heiken Ashi. Unlike traditional candlesticks, which represent the raw price movement of a specific period, this script calculates "smoothed" values to provide a clearer picture of market trends and momentum.
Core Logic and Data Processing
The primary objective of the script is to filter out the "noise" of market fluctuations by recalculating the price points for each bar based on four specific components:
- Opening Price: Instead of using the previous bar's actual open, the script calculates a starting point by averaging the previous period's high and low values.
- Closing Price: The script determines the closing point by taking a balanced average of the current period's highest, lowest, opening, and closing prices.
- Highs and Lows: The maximum and minimum points are adjusted to ensure they encompass the newly calculated open and close prices, maintaining structural integrity on the chart.
Visual Representation and Trend Identification
Once these adjusted values are calculated, the script translates them into a distinct visual format:
- Dynamic Color Coding: The logic distinguishes between bullish (upward) and bearish (downward) movements. When the calculated closing price is higher than the opening price, it signals upward momentum; when lower, it signals downward pressure.
- Histogram Overlay: The script renders these movements as a histogram on your chart. By using contrasting colors—specifically Red and Royal Blue—the indicator allows traders to immediately identify the direction of the trend without being distracted by minor price spikes.
- Smoothing Effect: Because each calculation relies on a blend of previous data points rather than just the most recent tick, the resulting visual provides a more fluid representation of market movement. This helps in identifying sustained trends and potential reversals more effectively than standard price bars alone.
Technical Behavior
The script is designed to automatically scan your chart history and update in real-time. It ensures that there is enough historical data available before it begins its calculations, ensuring that the visual display remains consistent and accurate as new price data arrives.
/*-----------------------------+
|			       |
| Shared by www.Aptrafx.com    |
|			       |
+------------------------------*/

//+------------------------------------------------------------------+
//|                                                  Heiken Ashi.mq4 |
//|                      Copyright © 2004, MetaQuotes Software Corp. |
//|                                        http://www.metaquotes.net |
//+------------------------------------------------------------------+
//| For Heiken Ashi we recommend next chart settings ( press F8 or   |
//| select on menu 'Charts'->'Properties...'):                       |
//|  - On 'Color' Tab select 'Black' for 'Line Graph'                |
//|  - On 'Common' Tab disable 'Chart on Foreground' checkbox and    |
//|    select 'Line Chart' radiobutton                               |
//+------------------------------------------------------------------+
#property copyright "Copyright © 2004, MetaQuotes Software Corp."
#property link      "http://www.metaquotes.net"

#property indicator_chart_window
#property indicator_buffers 4
#property indicator_color1 Red
#property indicator_color2 RoyalBlue
#property indicator_color3 Red
#property indicator_color4 RoyalBlue
//---- buffers
double ExtMapBuffer1[];
double ExtMapBuffer2[];
double ExtMapBuffer3[];
double ExtMapBuffer4[];
//----
int ExtCountedBars=0;
//+------------------------------------------------------------------+
//| Custom indicator initialization function                         |
//|------------------------------------------------------------------|
int init()
  {
//---- indicators
   SetIndexStyle(0,DRAW_HISTOGRAM, 0, 1, Red);
   SetIndexBuffer(0, ExtMapBuffer1);
   SetIndexStyle(1,DRAW_HISTOGRAM, 0, 1, RoyalBlue);
   SetIndexBuffer(1, ExtMapBuffer2);
   SetIndexStyle(2,DRAW_HISTOGRAM, 0, 1, Red);
   SetIndexBuffer(2, ExtMapBuffer3);
   SetIndexStyle(3,DRAW_HISTOGRAM, 0, 1, RoyalBlue);
   SetIndexBuffer(3, ExtMapBuffer4);
//----
   SetIndexDrawBegin(0,5);
//---- indicator buffers mapping
   SetIndexBuffer(0,ExtMapBuffer1);
   SetIndexBuffer(1,ExtMapBuffer2);
   SetIndexBuffer(2,ExtMapBuffer3);
   SetIndexBuffer(3,ExtMapBuffer4);
//---- initialization done
   return(0);
  }
//+------------------------------------------------------------------+
//| Custor indicator deinitialization function                       |
//+------------------------------------------------------------------+
int deinit()
  {
//---- TODO: add your code here

//----
   return(0);
  }
//+------------------------------------------------------------------+
//| Custom indicator iteration function                              |
//+------------------------------------------------------------------+
int start()
  {
   double haOpen, haHigh, haLow, haClose;
   if(Bars<=10) return(0);
   ExtCountedBars=IndicatorCounted();
//---- check for possible errors
   if (ExtCountedBars<0) return(-1);
//---- last counted bar will be recounted
   if (ExtCountedBars>0) ExtCountedBars--;
   int pos=Bars-ExtCountedBars-1;
   while(pos>=0)
     {
      haOpen=(ExtMapBuffer3[pos+1]+ExtMapBuffer4[pos+1])/2;
      haClose=(Open[pos]+High[pos]+Low[pos]+Close[pos])/4;
      haHigh=MathMax(High[pos], MathMax(haOpen, haClose));
      haLow=MathMin(Low[pos], MathMin(haOpen, haClose));
      if (haOpen<haClose)
        {
         ExtMapBuffer1[pos]=haLow;
         ExtMapBuffer2[pos]=haHigh;
        }
      else
        {
         ExtMapBuffer1[pos]=haHigh;
         ExtMapBuffer2[pos]=haLow;
        }
      ExtMapBuffer3[pos]=haOpen;
      ExtMapBuffer4[pos]=haClose;
 	   pos--;
     }
//----
   return(0);
  }
//+------------------------------------------------------------------+
Comments