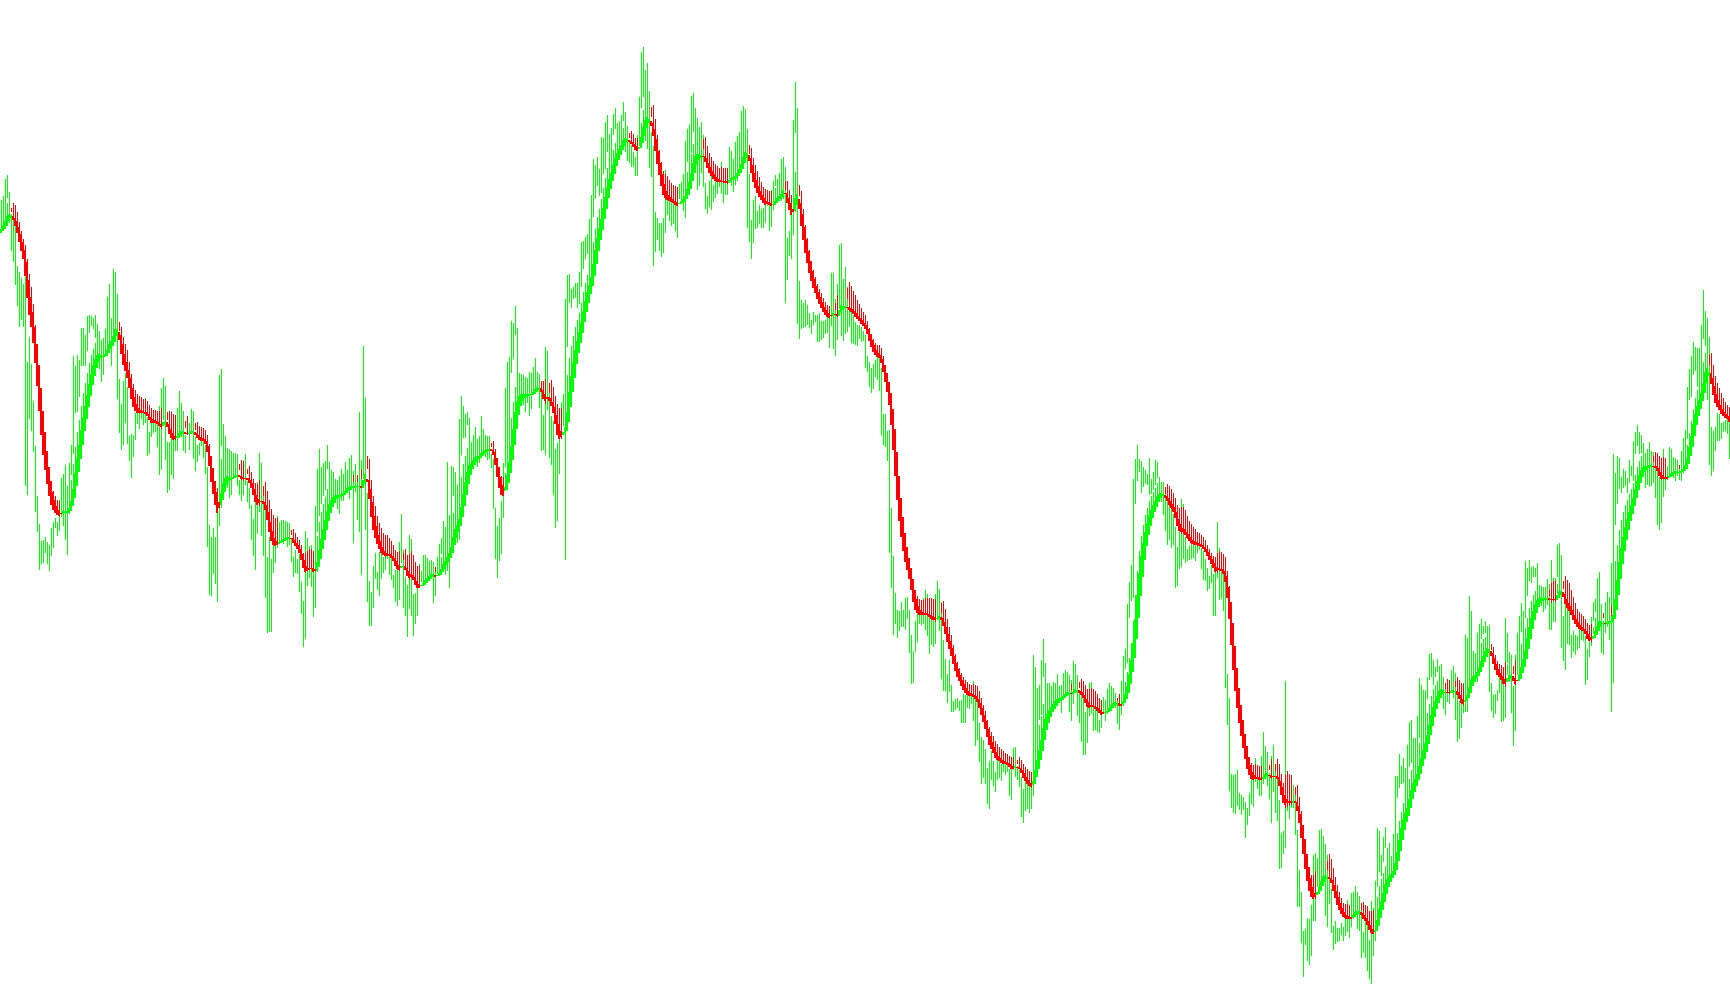
This tool is designed to provide traders with a cleaner, more stable view of market price action by combining two sophisticated mathematical concepts: Heiken Ashi candles and Moving Average smoothing. The primary goal of this script is to filter out the "market noise" (the erratic up and down movements) to help identify the underlying trend more clearly.
Core Logic Breakdown
1. Data Smoothing (The Foundation) Instead of looking at raw, jagged price data, the tool first processes the market's opening prices, closing prices, highs, and lows through a Moving Average calculation. By doing this, it creates a "weighted" average of the price history, which helps to dampen sudden, insignificant spikes and provides a more fluid representation of where the price is actually heading.
2. Heiken Ashi Transformation The tool then takes those smoothed averages and converts them into a modified Heiken Ashi format. Heikin Ashi is a popular charting technique that focuses on the average price of a period rather than just the extremes. This specific script calculates:
- Synthetic Open/Close Prices: It derives these values to represent the "body" of the trend.
- Dynamic Highs and Lows: It determines the range of each candle based on the highest and lowest points reached during that smoothed period.
3. Multi-Layer Smoothing (The Final Polish) To ensure the visual output is as stable as possible, the script performs a second round of smoothing on the calculated Heiken Ashi data. This final step ensures that the resulting bars transition smoothly from one to the next, preventing "flickering" or erratic movements that can occur with standard indicators.
How it Displays Information
The indicator renders as a series of histograms on your chart. These are visually divided into two distinct types:
- Trend Direction: The script uses different colors (Red and Lime) to signify the direction of the trend. It identifies whether the smoothed price action is currently leaning bullish or bearish based on the relationship between the calculated high and low points.
- Visual Consistency: Because it uses a "smoothed" approach, the resulting bars provide a more cohesive visual flow compared to standard candlesticks, making it easier for a trader to see if the momentum is accelerating, slowing down, or reversing.
Summary for the User
In short, this script acts as a sophisticated filter. It takes raw market data, averages it to remove noise, converts it into a trend-focused Heikin Ashi format, and then smooths it once more. The result is a visual aid that highlights the dominant direction of the market while hiding the distracting minor fluctuations of price.
//+------------------------------------------------------------------+
//|                                         Heiken Ashi Smoothed.mq4 |
//|                                                                  |
//|                                                      mod by Raff |
//+------------------------------------------------------------------+
#property copyright "Copyright © 2006, Forex-TSD.com "
#property link      "http://www.forex-tsd.com/"
//----
#property indicator_chart_window
#property indicator_buffers 4
#property indicator_color1 Red
#property indicator_color2 Lime
#property indicator_color3 Red
#property indicator_color4 Lime
//---- parameters
extern int MaMetod =2;
extern int MaPeriod=6;
extern int MaMetod2 =3;
extern int MaPeriod2=2;
//---- buffers
double ExtMapBuffer1[];
double ExtMapBuffer2[];
double ExtMapBuffer3[];
double ExtMapBuffer4[];
double ExtMapBuffer5[];
double ExtMapBuffer6[];
double ExtMapBuffer7[];
double ExtMapBuffer8[];
//----
int ExtCountedBars=0;
//+------------------------------------------------------------------+
//| Custom indicator initialization function                         |
//|------------------------------------------------------------------|
int init()
  {
//---- indicators
   IndicatorBuffers(8);
   SetIndexStyle(0,DRAW_HISTOGRAM, 0, 1, Red);
   SetIndexBuffer(0, ExtMapBuffer1);
   SetIndexStyle(1,DRAW_HISTOGRAM, 0, 1, Lime);
   SetIndexBuffer(1, ExtMapBuffer2);
   SetIndexStyle(2,DRAW_HISTOGRAM, 0, 3, Red);
   SetIndexBuffer(2, ExtMapBuffer3);
   SetIndexStyle(3,DRAW_HISTOGRAM, 0, 3, Lime);
   SetIndexBuffer(3, ExtMapBuffer4);
//----
   SetIndexDrawBegin(0,5);
//---- indicator buffers mapping
   SetIndexBuffer(0,ExtMapBuffer1);
   SetIndexBuffer(1,ExtMapBuffer2);
   SetIndexBuffer(2,ExtMapBuffer3);
   SetIndexBuffer(3,ExtMapBuffer4);
   SetIndexBuffer(4,ExtMapBuffer5);
   SetIndexBuffer(5,ExtMapBuffer6);
   SetIndexBuffer(6,ExtMapBuffer7);
   SetIndexBuffer(7,ExtMapBuffer8);
//---- initialization done
   return(0);
  }
//+------------------------------------------------------------------+
//| Custor indicator deinitialization function                       |
//+------------------------------------------------------------------+
int deinit()
  {
//---- TODO: add your code here
//----
   return(0);
  }
//+------------------------------------------------------------------+
//| Custom indicator iteration function                              |
//+------------------------------------------------------------------+
int start()
  {
   double maOpen, maClose, maLow, maHigh;
   double haOpen, haHigh, haLow, haClose;
   if(Bars<=10) return(0);
   ExtCountedBars=IndicatorCounted();
//---- check for possible errors
   if (ExtCountedBars<0) return(-1);
//---- last counted bar will be recounted
   if (ExtCountedBars>0) ExtCountedBars--;
   int pos=Bars-ExtCountedBars-1;
   while(pos>=0)
     {
      maOpen=iMA(NULL,0,MaPeriod,0,MaMetod,MODE_OPEN,pos);
      maClose=iMA(NULL,0,MaPeriod,0,MaMetod,MODE_CLOSE,pos);
      maLow=iMA(NULL,0,MaPeriod,0,MaMetod,MODE_LOW,pos);
      maHigh=iMA(NULL,0,MaPeriod,0,MaMetod,MODE_HIGH,pos);
//----
      haOpen=(ExtMapBuffer5[pos+1]+ExtMapBuffer6[pos+1])/2;
      haClose=(maOpen+maHigh+maLow+maClose)/4;
      haHigh=MathMax(maHigh, MathMax(haOpen, haClose));
      haLow=MathMin(maLow, MathMin(haOpen, haClose));
      if (haOpen<haClose)
        {
         ExtMapBuffer7[pos]=haLow;
         ExtMapBuffer8[pos]=haHigh;
        }
      else
        {
         ExtMapBuffer7[pos]=haHigh;
         ExtMapBuffer8[pos]=haLow;
        }
      ExtMapBuffer5[pos]=haOpen;
      ExtMapBuffer6[pos]=haClose;
      pos--;
     }
   int i;
   for(i=0; i<Bars; i++) ExtMapBuffer1[i]=iMAOnArray(ExtMapBuffer7,Bars,MaPeriod2,0,MaMetod2,i);
   for(i=0; i<Bars; i++) ExtMapBuffer2[i]=iMAOnArray(ExtMapBuffer8,Bars,MaPeriod2,0,MaMetod2,i);
   for(i=0; i<Bars; i++) ExtMapBuffer3[i]=iMAOnArray(ExtMapBuffer5,Bars,MaPeriod2,0,MaMetod2,i);
   for(i=0; i<Bars; i++) ExtMapBuffer4[i]=iMAOnArray(ExtMapBuffer6,Bars,MaPeriod2,0,MaMetod2,i);
//----
   return(0);
  }
//+------------------------------------------------------------------+
Comments