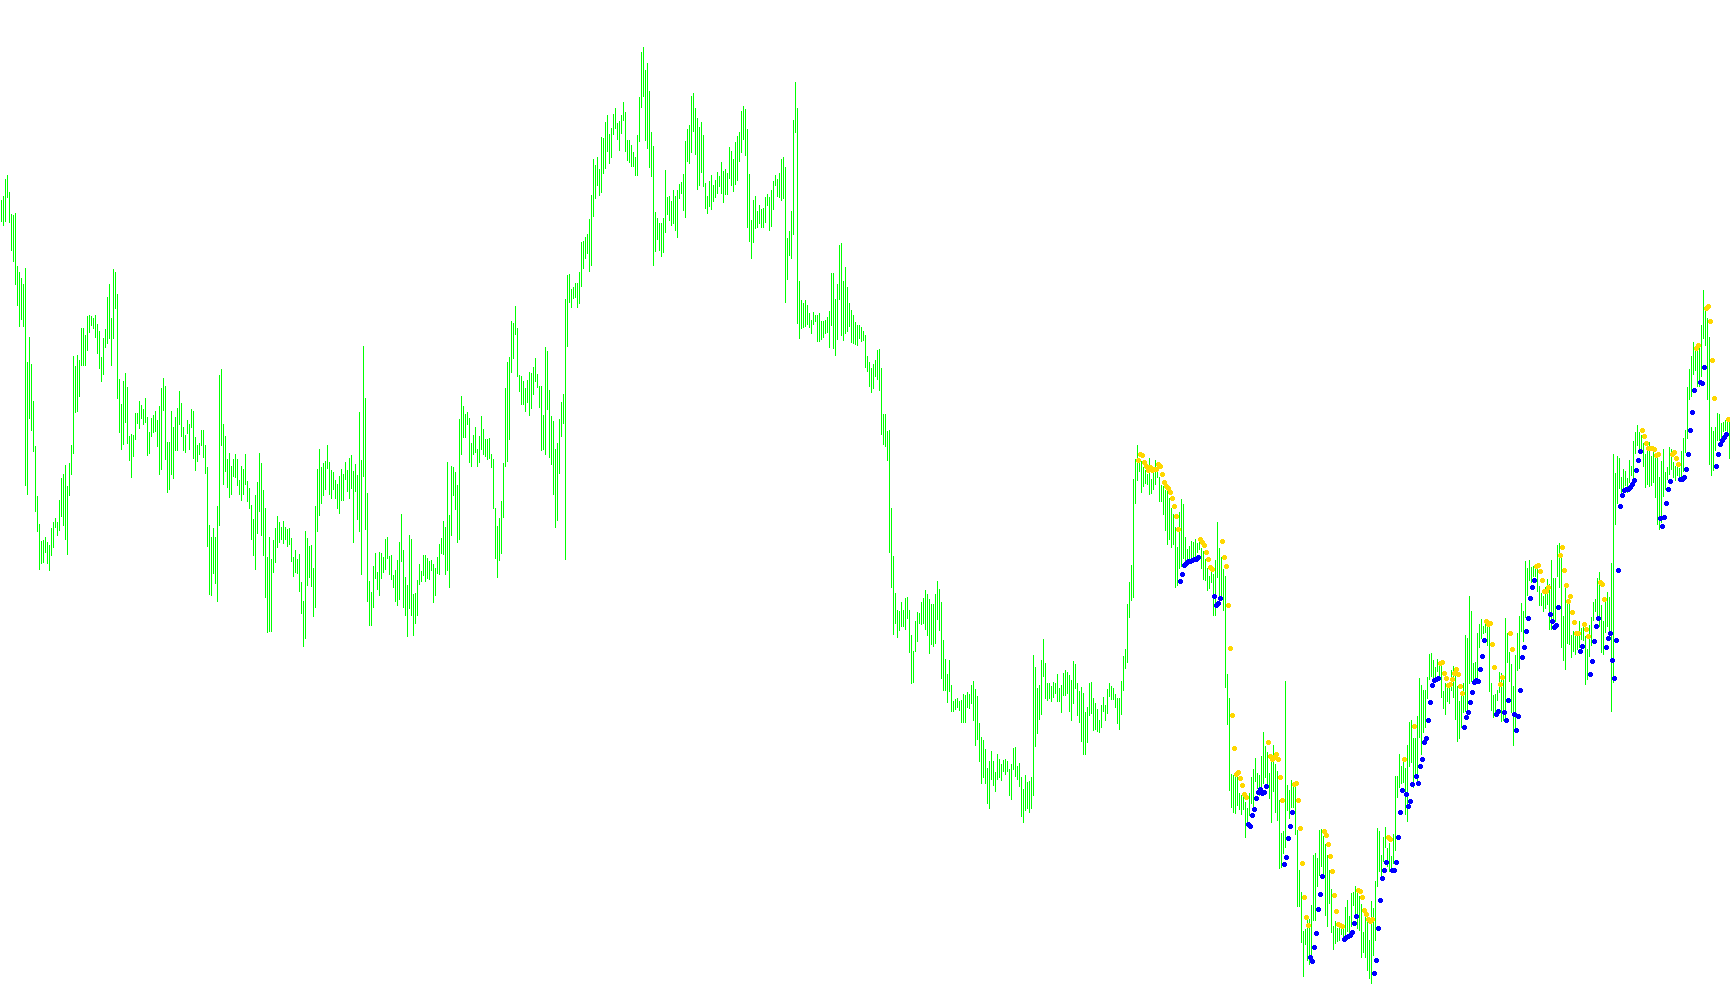
This script is designed to provide a visual signal on your trading charts by identifying specific shifts in price momentum. It acts as a trend-following tool that focuses on the relationship between current market prices and moving averages of the highest and lowest points reached in recent history.
How the Logic Works
The tool scans the market data by looking at a specific number of previous bars (which you can customize via the settings). Instead of looking only at where the price closes, it specifically tracks two "boundaries":
- The High Boundary: The average of the highest prices over a set period.
- The Low Boundary: The average of the lowest prices over a set period.
The Signaling Mechanism
The script works by comparing the current closing price against these two boundaries to determine the "state" of the market. It follows a specific set of rules to decide when to display a visual marker:
- Bullish Momentum (Upward Signal): If the current price closes above the high boundary and was previously in a neutral or downward state, the script recognizes a potential upward move. It then places a marker just below the high boundary.
- Bearish Momentum (Downward Signal): Conversely, if the price closes below the low boundary while coming from a neutral or upward state, the script identifies a potential downward move and places a marker just above the low boundary.
Key Features for the User
- Visual Clarity: The script uses distinct markers (arrows) to highlight these transition points, making it easier to spot potential trend changes at a glance without cluttering the price action.
- Customizable Sensitivity: Through the input parameters, you can adjust how many bars of history the tool considers and the period used for the averages. This allows you to switch between identifying long-term trend shifts or shorter, more rapid price movements.
- Stability: The logic includes a "memory" component (tracking previous states) to ensure that signals are only generated during the initial transition of a trend, helping to filter out constant noise when the price is hovering near the boundaries.
Indicators Used
Miscellaneous
14
Views
0
Downloads
0
Favorites
Hi-Lo
//+------------------------------------------------------------------+
//|                                                        Hi-Lo.mq4 |
//|                                                                  |
//|                                        Ramdass - Conversion only |
//+------------------------------------------------------------------+

#property indicator_chart_window
#property indicator_buffers 2
#property indicator_color1 Red
#property indicator_color2 Lime
//---- input parameters
extern int Per=3;
extern int CountBars=300;
//---- buffers
double Up[];
double Down[];
//+------------------------------------------------------------------+
//| Custom indicator initialization function                         |
//+------------------------------------------------------------------+
int init()
  {

//---- indicator line
   IndicatorBuffers(2);
   SetIndexStyle(0,DRAW_ARROW);
   SetIndexArrow(0,159);
   SetIndexStyle(1,DRAW_ARROW);
   SetIndexArrow(1,159);
   SetIndexBuffer(0,Up);
   SetIndexBuffer(1,Down);
//----
//----
   return(0);
  }
//+------------------------------------------------------------------+
//| Hi-Lo                                                         |
//+------------------------------------------------------------------+
int start()
  {
   SetIndexDrawBegin(0,Bars-CountBars+Per);
   SetIndexDrawBegin(1,Bars-CountBars+Per);
   int i,counted_bars=IndicatorCounted();
   bool Pr=false, PrevPr=false;
   double val,val2;
//----
   if(CountBars<=Per) return(0);
//---- initial zero
   if(counted_bars<1)
   {
      for(i=1;i<=Per;i++) Up[CountBars-i]=0.0;
      for(i=1;i<=Per;i++) Down[CountBars-i]=0.0;
   }
//----
   i=CountBars-Per-1;
//   if(counted_bars>=CCIPeriod1) i=Bars-counted_bars-1;
   while(i>=0)
     {
      val=iMA(NULL,0,Per,1,MODE_SMA,PRICE_HIGH,i);
      val2=iMA(NULL,0,Per,1,MODE_SMA,PRICE_LOW,i);

if (Close[i]<val2 && PrevPr==true) Pr=false;
if (Close[i]>val && PrevPr==false) Pr=true;
PrevPr=Pr;
Up[i]=0.0; Down[i]=0.0;
if (Pr==false) Up[i] = val+2*Point;
if (Pr==true) Down[i] = val2-2*Point;

      i--;
     }
   return(0);
  }
//+------------------------------------------------------------------+
Comments